View the full-size version of this graphic
Stock Markets in 2025: The Ups, Downs, and Returns Globally
Key Takeaways
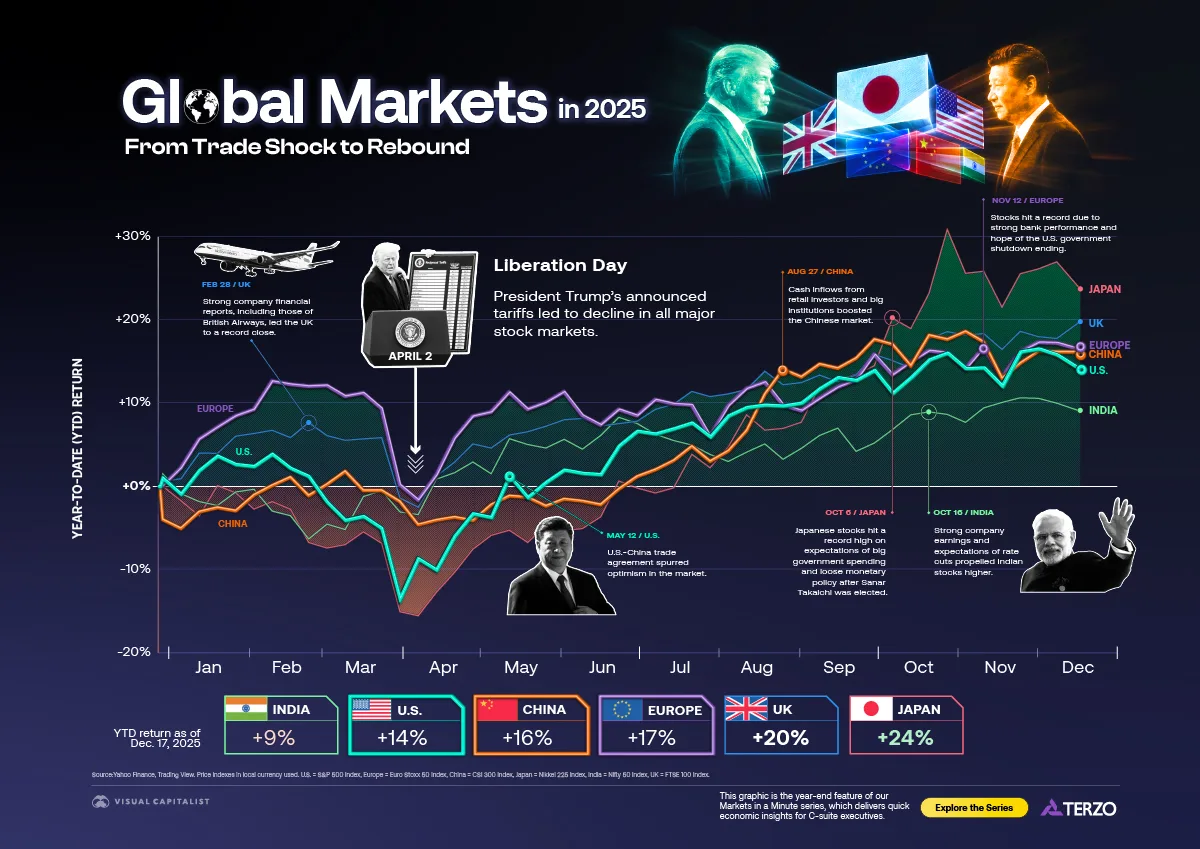
- Japan had the highest return of 24% as of December 17, 2025.
- The U.S. had a 14% return, the second lowest among major stock markets in 2025.
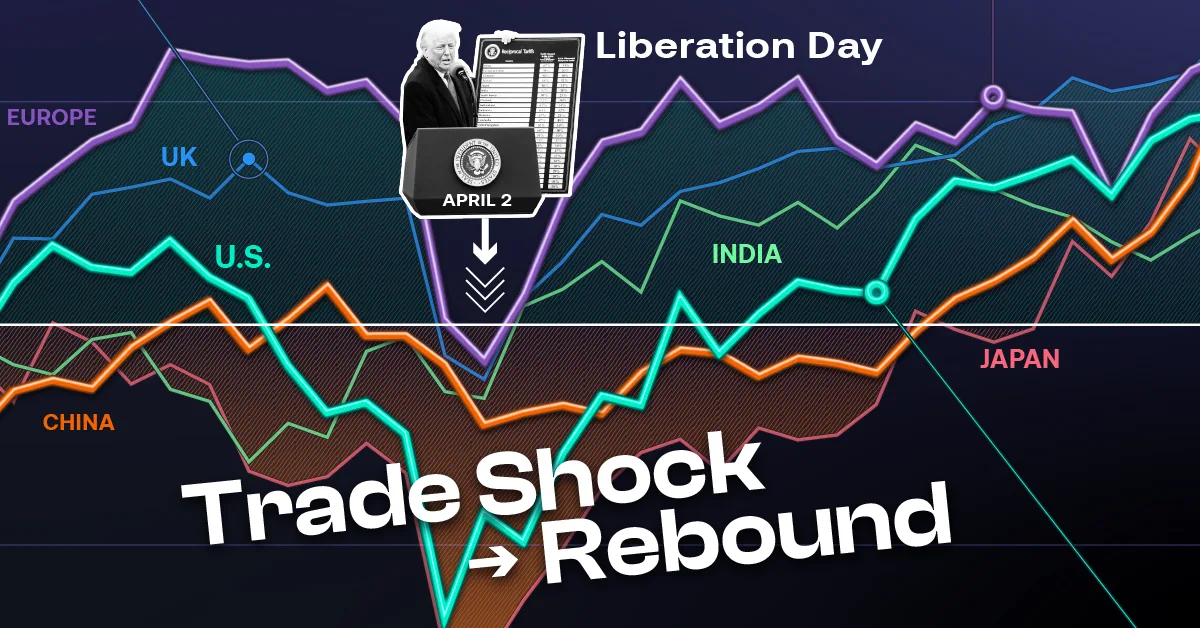
Amid trade shocks and strained geopolitical ties, stock markets in 2025 faced a test of resilience. How long did it take them to recover, and which key moments contributed to market rebounds?
In this graphic, we explore the performance of major stock markets and the milestones that fueled ups and downs throughout the year. It’s the year-end feature of our Markets in a Minute series with Terzo, which delivers quick economic insights for C-suite executives.
Ranking the Returns of Stock Markets in 2025
Using price return data in each market’s local currency, the table below shows the leaders and laggards in 2025 as of December 17.
Japan led with a 24% return, four percentage points above the UK in second place.
| Market | YTD Return as of Dec. 17, 2025 |
|---|---|
 Japan Japan |
+24% |
 UK UK |
+20% |
 Europe Europe |
+17% |
 China China |
+16% |
 U.S. U.S. |
+14% |
 India India |
+9% |
Source: Yahoo Finance, TradingView. U.S. = S&P 500 Index, Europe = Euro Stoxx 50 Index, China = CSI 300 Index, Japan = Nikkei 225 Index, India = Nifty 50 Index, UK = FTSE 100 Index. The chart uses weekly data.
Meanwhile, the U.S. had a return of 14%, the second lowest compared to other major stock markets in 2025.
The Liberation Day Drop
On April 2, the Trump administration announced sweeping tariffs to reduce trade deficits and boost American industry. All of the major stock markets saw declines as investors reassessed trade and growth prospects.
If we zoom in to daily data (as opposed to the weekly data shown in the graphic), Japan and Europe were tied for the largest decline. The UK experienced the longest time to recovery.
| Market | Liberation Day Drop | Trading Days to Recovery |
|---|---|---|
| Europe |
-13% | 21 |
| Japan |
-13% | 14 |
| U.S. |
-12% | 18 |
| UK |
-11% | 27 |
| China |
-8% | 25 |
| India |
-4% | 6 |
The drop is measured from the market’s close on April 1—just before the Liberation Day announcement—to its subsequent low. Recovery is defined as the number of days it took to return to the April 1 closing value.
On the other hand, India had the lowest and shortest drop in response to Liberation Day tariffs. Only 12% of India’s economy is dependent on exporting goods, and merchandise exports to the U.S. make up just 2.1% of the country’s GDP.
Rebounds Around the World
All major stock markets in 2025 rallied in the wake of Liberation Day.
In Japan, the stock market hit a record high on October 6 after Sanae Takaichi was elected as the leader of the ruling party, putting her on track to become the country’s prime minister. The rally was based on investors’ expectations of stronger government spending and stable monetary policy under Takaichi’s leadership.
The U.S. saw strong gains after reaching a trade agreement with China. American markets were also fueled by rate cuts, earnings growth, and strong consumer spending.

This is a special year-in-review edition of our Markets in a Minute series, which delivers quick economic insights for C-suite executives. Explore the full series for more visual market breakdowns.
-

 Markets1 week ago
Mapped: The Biggest Housing Bubble Risks Globally
Which global cities are most at risk of a housing bubble? This new map ranks the world’s most overheated real estate markets.
-

 Technology2 weeks ago
Ranked: The Top Factors That Build AI Trust
Want AI your team will trust? Pull back the curtain on the top factors that make people believe in artificial intelligence.
-

 Technology3 weeks ago
Ranked: AI Hallucination Rates by Model
Find out how common AI hallucination is for leading models, and what that means for the businesses that rely on them.
-

 Technology3 weeks ago
The Dangers of AI: Visualizing the Top Risks Companies Face
Among the dangers of AI, one stands apart as causing trouble for almost a third of companies. What do leaders need to know?
-

 Business1 month ago
Ranked: Which Universities Build the Most Entrepreneurs?
Which university has had the most alumni become entrepreneurs in the last decade? Hint: its not Stanford or Harvard.
-

 Economy1 month ago
Mapped: Where Workers Are Supporting the Most Seniors
In many advanced economies, the number of retirees is climbing while the working-age population shrinks. What are the countries where workers are supporting the most seniors?
-

 Economy2 months ago
The United States of Unemployment
The national unemployment rate for the U.S. rose to 4.3% in August 2025. But that figure masks vast differences in local labor market health across states.
-

 Markets2 months ago
Ranked: The Economies Most Dependent on International Trade
A trade war has threatened economic ties in 2025. Which economies are most exposed to these shifts in international trade?
-

 Economy2 months ago
Top Countries Behind U.S. Tariff Revenue
Tariff rates vary by country, as does the value of goods each nation exports to the U.S. Which countries contribute the most?
-

 Business2 months ago
Industries Hiring and Firing the Most Employees
As the U.S. labor market cools, which industries are still hiring—and which are cutting back their workforces?
-

 Markets3 months ago
The $150T Global Debt Market
Global debt continues to climb, reaching $150T in Q1 2025. Which countries carry the heaviest burdens?
-
 Money3 months ago
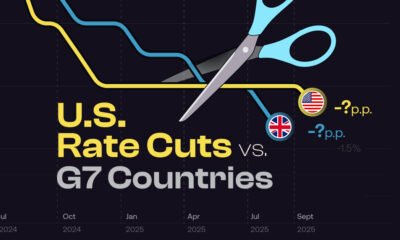
NEW: Fed Rate Cuts vs. Other G7 Countries
How do Fed rate cuts in the U.S. compare with the interest rate changes in other G7 countries, and what does it mean for business?
-
 Jobs3 months ago
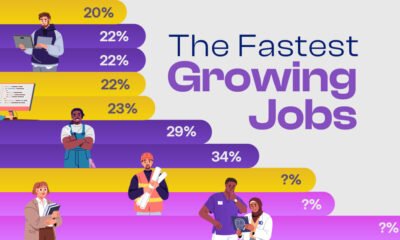
Ranked: The Fastest Growing Jobs (2024-2034)
Explore the fastest growing jobs by projected growth rate, plus salary insights, in a rapidly changing job market.
-

 Investor Education4 months ago
The $127 Trillion Global Stock Market in One Giant Chart
This graphic pieces together the $127T global stock market to reveal which countries and regions dominate—and how much equity they control.
-

 Personal Finance4 months ago
Late to the Ladder: The Rise in First-Time Home Buyers’ Age
The median age of first-time home buyers has reached a historic high. See just how long it’s taking people to get on the property ladder.
-

 Markets5 months ago
Unpacking Real Estate Ownership by Generation (1991 vs. 2025)
The Silent Generation’s share of real estate has dropped dramatically as people age, but how have Baby Boomers, Gen X, and Millennials fared?
-

 Business5 months ago
America’s Economic Engines: The Biggest Industry in Every State
Real estate is the biggest industry by GDP in 26 states. Find out why it dominates—and what fuels the rest of the country.
-

 Maps5 months ago
Mapped: Manufacturing as a Share of GDP, by U.S. State
Tariffs are rising to boost American-made goods. Which states gain the most—and least—from manufacturing today?
-

 Technology6 months ago
Profit Powerhouses: Ranking The Top 10 U.S. Companies by Net Income
Collectively, the ten most profitable U.S. companies have a net income of $684 billion—more than the entire GDP of Belgium.
-

 Money6 months ago
Millionaire Hubs: Mapping the World’s Wealthiest Cities
New York City has the highest millionaire population globally. Which other cities attract the world’s wealthiest?
-
 Economy6 months ago
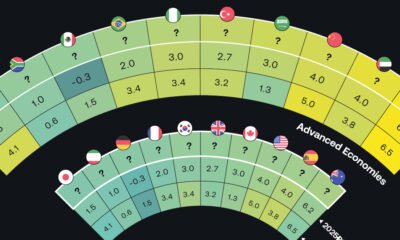
Tomorrow’s Growth: GDP Projections in Key Economies
The global economy is expected to have slighter slower growth going forward. Which countries are on track to have the biggest GDP increases?
-
 Money7 months ago
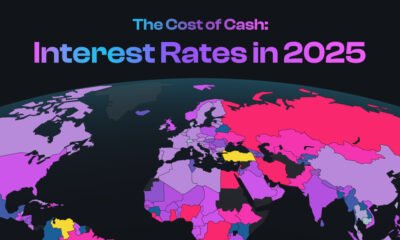
Mapped: Interest Rates by Country in 2025
The U.S. has kept their target rate the same at 4.25-4.50%. What do interest rates look like in other countries amid economic uncertainty?
-
 Markets8 months ago
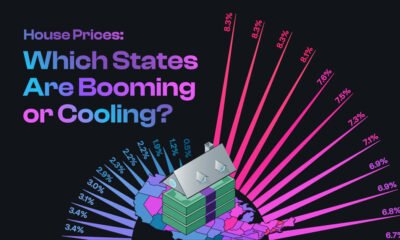
U.S. Housing Prices: Which States Are Booming or Cooling?
The national housing market saw a 4.5% rise in house prices. This graphic reveals which states had high price growth, and which didn’t.
-

 Investor Education9 months ago
The Silent Thief: How Inflation Erodes Investment Gains
If you held a $1,000 investment from 1975-2024, this chart shows how the inflation rate can drastically reduce the value of your money.
-

 Politics10 months ago
Trade Tug of War: America’s Largest Trade Deficits
Trump cites trade deficits—the U.S. importing more than it exports—as one reason for tariffs. Which countries represent the largest deficits?