
3 Factors Dragging Down the U.S. Dollar
The U.S. dollar (USD) is under pressure—but what’s driving the decline? Understanding these dynamics is key for investors looking to prepare for what’s ahead.
This graphic, created in partnership with New York Life Investments, provides visual context to the recent weakness in the USD. It explores three key forces underpinning this trend.
The Descent of the U.S. Dollar
The U.S. dollar often acts as a barometer for the global economy, reflecting everything from domestic growth prospects to international investor sentiment.
Recently, however, the dollar’s trajectory has tilted downward. Since the beginning of the year, the USD has fallen approximately 8%.
| Date | Index |
|---|---|
| 2020-08-03 | 117.82 |
| 2020-09-01 | 115.58 |
| 2020-10-01 | 116.73 |
| 2020-11-02 | 116.24 |
| 2020-12-01 | 112.81 |
| 2021-01-04 | 111.21 |
| 2021-02-01 | 112.43 |
| 2021-03-01 | 112.54 |
| 2021-04-01 | 113.75 |
| 2021-05-03 | 112.02 |
| 2021-06-01 | 110.52 |
| 2021-07-01 | 112.75 |
| 2021-08-02 | 112.68 |
| 2021-09-01 | 112.88 |
| 2021-10-01 | 114.39 |
| 2021-11-01 | 114.22 |
| 2021-12-01 | 115.90 |
| 2022-01-03 | 115.42 |
| 2022-02-01 | 115.38 |
| 2022-03-01 | 115.81 |
| 2022-04-01 | 115.48 |
| 2022-05-02 | 119.88 |
| 2022-06-01 | 118.69 |
| 2022-07-01 | 121.51 |
| 2022-08-01 | 121.42 |
| 2022-09-01 | 124.40 |
| 2022-10-03 | 127.08 |
| 2022-11-01 | 127.40 |
| 2022-12-01 | 122.01 |
| 2023-01-02 | 121.44 |
| 2023-02-01 | 118.64 |
| 2023-03-01 | 120.70 |
| 2023-04-03 | 119.43 |
| 2023-05-01 | 119.58 |
| 2023-06-01 | 120.26 |
| 2023-07-03 | 119.56 |
| 2023-08-01 | 118.92 |
| 2023-09-01 | 121.10 |
| 2023-10-02 | 123.36 |
| 2023-11-01 | 124.08 |
| 2023-12-01 | 120.25 |
| 2024-01-01 | 118.77 |
| 2024-02-01 | 120.68 |
| 2024-03-01 | 121.37 |
| 2024-04-01 | 121.89 |
| 2024-05-01 | 123.38 |
| 2024-06-03 | 122.72 |
| 2024-07-01 | 124.77 |
| 2024-08-01 | 124.16 |
| 2024-09-02 | 122.56 |
| 2024-10-01 | 121.92 |
| 2024-11-01 | 125.04 |
| 2024-12-02 | 127.35 |
| 2025-01-01 | 129.49 |
| 2025-02-03 | 129.28 |
| 2025-03-03 | 127.96 |
| 2025-04-01 | 126.68 |
| 2025-05-01 | 123.48 |
| 2025-06-02 | 121.55 |
| 2025-07-01 | 119.77 |
| 2025-08-01 | 121.61 |
| 2025-09-01 | 120.60 |
Many factors go into determining a currency’s relative strength. Below, we explore three forces at play.
1. GDP Growth Projections Are Soft
U.S. Gross Domestic Product (GDP) growth has been trending downward for decades. Between 2020 and 2024, the economy expanded at an average annual rate of just 2.4%, according to World Bank data.
| Years | GDP Growth (%) |
|---|---|
| 1960s | 4.7 |
| 1970s | 3.2 |
| 1980s | 3.1 |
| 1990s | 3.2 |
| 2000s | 1.9 |
| 2010s | 2.4 |
| 2020s (2020-2024) | 2.4 |
| 2025P | 1.9 |
| 2026P | 2.0 |
Looking ahead, the IMF expects this slowdown to persist, projecting growth to slip to 1.9% in 2025 and remain subdued at 2.0% in 2026. Weaker economic momentum makes U.S. assets—including the dollar—less appealing to global investors.
2. Inflation Expectations: Stable But Elevated
Higher inflation weighs on the USD by chipping away at purchasing power, and expectations are still running high with reshoring and trade tensions.
| Quarter | Year | 1-Year Inflation Expectations (%) |
|---|---|---|
| Q2 | 1978 | 6.7 |
| Q2 | 1979 | 9.8 |
| Q2 | 1980 | 9.7 |
| Q2 | 1981 | 7.3 |
| Q2 | 1982 | 4.5 |
| Q2 | 1983 | 3.3 |
| Q2 | 1984 | 4.1 |
| Q2 | 1985 | 3.3 |
| Q2 | 1986 | 2.7 |
| Q2 | 1987 | 3.3 |
| Q2 | 1988 | 3.4 |
| Q2 | 1989 | 4.3 |
| Q2 | 1990 | 3.6 |
| Q2 | 1991 | 3.2 |
| Q2 | 1992 | 3.0 |
| Q2 | 1993 | 3.1 |
| Q2 | 1994 | 2.9 |
| Q2 | 1995 | 3.0 |
| Q2 | 1996 | 3.0 |
| Q2 | 1997 | 2.9 |
| Q2 | 1998 | 2.6 |
| Q2 | 1999 | 2.7 |
| Q2 | 2000 | 3.0 |
| Q2 | 2001 | 3.1 |
| Q2 | 2002 | 2.7 |
| Q2 | 2003 | 2.2 |
| Q2 | 2004 | 3.2 |
| Q2 | 2005 | 3.2 |
| Q2 | 2006 | 3.4 |
| Q2 | 2007 | 3.3 |
| Q2 | 2008 | 5.0 |
| Q2 | 2009 | 2.9 |
| Q2 | 2010 | 3.0 |
| Q2 | 2011 | 4.2 |
| Q2 | 2012 | 3.1 |
| Q2 | 2013 | 3.1 |
| Q2 | 2014 | 3.2 |
| Q2 | 2015 | 2.7 |
| Q2 | 2016 | 2.6 |
| Q2 | 2017 | 2.5 |
| Q2 | 2018 | 2.8 |
| Q2 | 2019 | 2.7 |
| Q2 | 2020 | 2.8 |
| Q2 | 2021 | 4.1 |
| Q2 | 2022 | 5.3 |
| Q2 | 2023 | 4.0 |
| Q2 | 2024 | 3.2 |
| Q2 | 2025 | 6.0 |
The 3-month average of University of Michigan inflation expectations has climbed to 6.0%, the highest since 1981.
3. Interest Rates Are Down
The Federal Reserve delivered its first rate cut since late 2024 this week, trimming rates by a quarter point and signaling more reductions could follow. The move reflects mounting concerns over slowing economic growth and a weakening job market.
| Date | Effective Fed Funds Rate (%) |
|---|---|
| 2024-06-01 | 5.33 |
| 2024-07-01 | 5.33 |
| 2024-08-01 | 5.33 |
| 2024-09-01 | 5.13 |
| 2024-10-01 | 4.83 |
| 2024-11-01 | 4.64 |
| 2024-12-01 | 4.48 |
| 2025-01-01 | 4.33 |
| 2025-02-01 | 4.33 |
| 2025-03-01 | 4.33 |
| 2025-04-01 | 4.33 |
| 2025-05-01 | 4.33 |
| 2025-06-01 | 4.33 |
| 2025-07-01 | 4.33 |
| 2025-08-01 | 4.33 |
While U.S. yields remain elevated by recent standards, the cut makes dollar-denominated assets less attractive, adding fresh pressure on the currency.
Why the Dollar’s Direction Matters
While the U.S. dollar has recently softened, strategists see risks as roughly balanced. Competing forces—like tariffs and global growth concerns—suggest continued volatility, making it a good time to speak with your financial professional about how your portfolio is positioned.

Explore more insights from New York Life Investments
-

 Markets2 months ago
The Case for Active ETFs
Active ETFs are funds managed with the goal of beating the market—and they’re rapidly reshaping the asset management industry.
-

 Economy5 months ago
Charting U.S. Trade Relationships
Maintaining a balanced perspective on trade is crucial. Which countries does the U.S. have the largest trade deficits and surpluses with?
-
 Markets7 months ago
Trading Under Trump: Lessons from 2017-2021
With the second term of Trump underway, all eyes are on the markets to see how they react. Which sectors and regions that thrived last time?
-
 Markets9 months ago
2024 in Review: Stock, Bond, and Real Estate Performance
How did equities, fixed income, and real estate (and their underlying sectors) perform in the U.S. throughout 2024?
-
 Money11 months ago
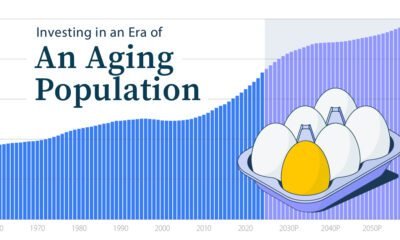
Investing in an Era of an Aging Population
The U.S. population is aging. By 2070, the number of people over 65 will outnumber children. How can investors prepare?
-

 Politics1 year ago
Does it Matter to the Market Who Wins the White House?
After the president takes office, how have the market and the economy performed under Democrats vs Republicans?
-

 Markets1 year ago
Magnificent 7 Mania: Why Diversification Still Matters
The Magnificent Seven stocks all outperformed the S&P 500 in 2023. However, it’s crucial to remember that diversifying a portfolio at both the company level and…
-
 Markets1 year ago
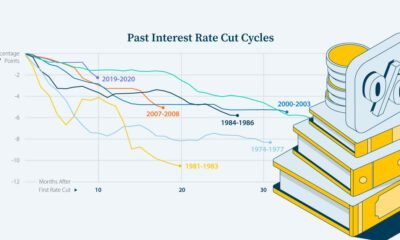
What History Reveals About Interest Rate Cuts
How have previous cycles of interest rate cuts in the U.S. impacted the economy and financial markets?
-

 Markets1 year ago
Beyond Big Names: The Case for Small- and Mid-Cap Stocks
Small- and mid-cap stocks have historically outperformed large caps. What are the opportunities and risks to consider?
-

 Markets2 years ago
Visualizing the Record $6 Trillion in Cash on the Sidelines
Assets in money market funds are at all-time highs. But as investors stockpile cash, are they missing out on today’s stock market rally?
-
 Markets2 years ago
What Drove Market Volatility in 2023?
Market volatility is often considered a gauge for investor fear. How did investors react as the economic climate evolved in 2023?
-

 Markets2 years ago
3 Reasons Why AI Enthusiasm Differs from the Dot-Com Bubble
Valuations are much lower than they were during the dot-com bubble, but what else sets the current AI enthusiasm apart?
-

 Investor Education2 years ago
Paying Less Tax: The Tax-Loss Harvesting Advantage
Learn how tax-loss harvesting works by using capital losses to offset capital gains, potentially reducing your tax bill.
-

 Markets2 years ago
What’s Driving U.S. Stock Market Returns?
The performance of the S&P 500 has been strong so far in 2023. But what is fueling these stock market returns?
-

 Markets2 years ago
Decoding the Economics of a Soft Landing
Will the Federal Reserve achieve a soft landing? Here are key factors that play an important role in the direction of the U.S. economy.
-

 Markets2 years ago
3 Reasons to Explore International Stocks Now
International stocks are trading at 20-year lows relative to U.S. stocks, which could present attractive buying opportunities for investors.
-

 Markets2 years ago
Fact or Fiction? Test Your Knowledge About Investing During a Recession
From sector performance to market recoveries, test your knowledge about investing during a recession with this interactive quiz.
-

 Markets2 years ago
Reimagining the 60/40 Portfolio for Today’s Market
Amid uncertain economic times, a new allocation for the 60/40 portfolio may help investors target higher risk-adjusted returns.
-
 Markets2 years ago
The Recession Playbook: Three Strategies for Investors
How can investors prepare for a market downturn? What goes into a recession investment strategy? We look at three sectors to consider.
-
 Markets3 years ago
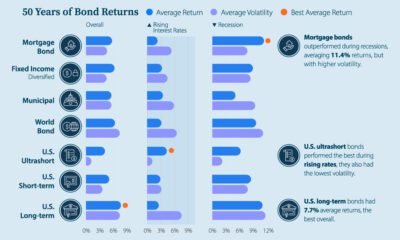
A Visual Guide to Bond Market Dynamics
What factors impact the bond market? Here’s how current interest rates, bond returns, and market volatility compare in a historical context.
-
 Investor Education3 years ago
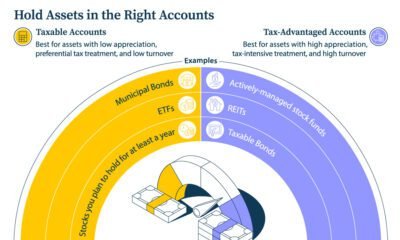
5 Tax Tips for Investors
Learn five tax tips that may help maximize the after-tax value of your investments, including which assets may be best for certain accounts.
-

 Markets3 years ago
The Top Google Searches Related to Investing in 2022
What was on investors’ minds in 2022? Discover the top Google searches and how the dominant trends played out in portfolios.


