Mapped: Annual Retirement Costs by State
This was originally posted on our Voronoi app. Download the app for free on iOS or Android and discover incredible data-driven charts from a variety of trusted sources.
Key Takeaways
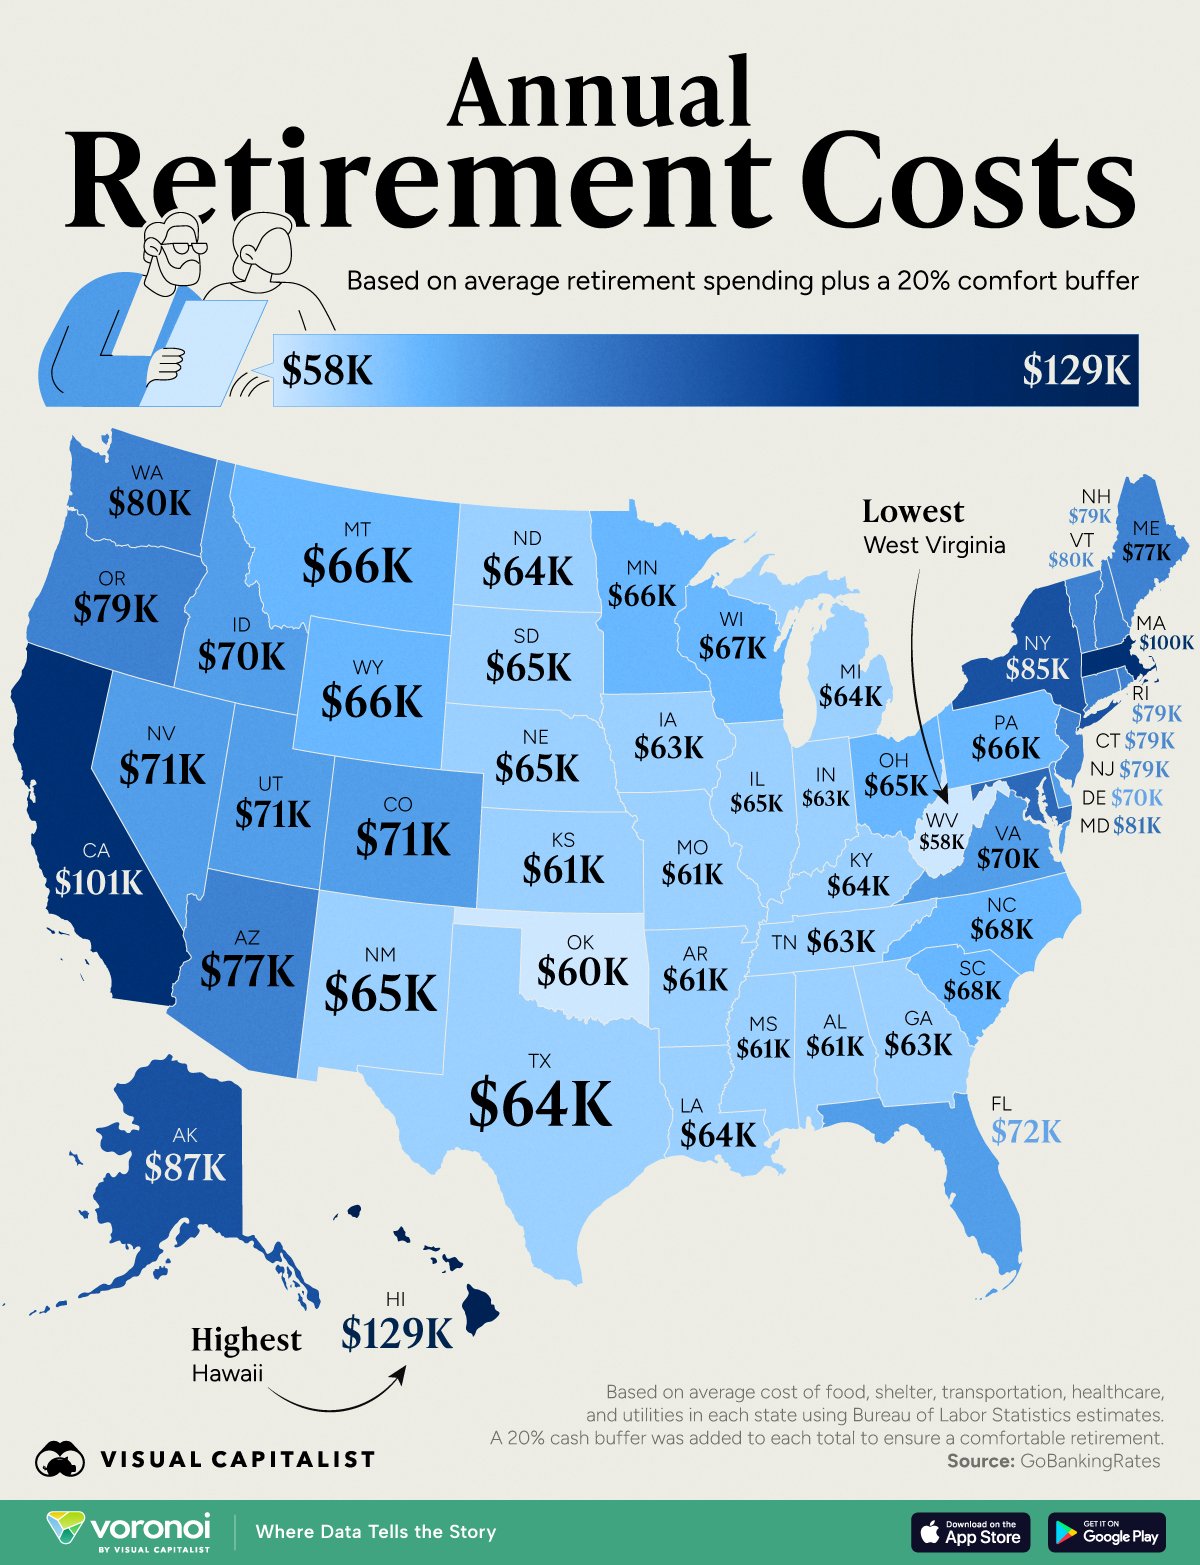
- Hawaii is the most expensive state to retire comfortably in, requiring nearly $130K per year
- That’s more than double of the cheapest states, which include West Virginia ($58K annually) and Oklahoma ($60K annually)
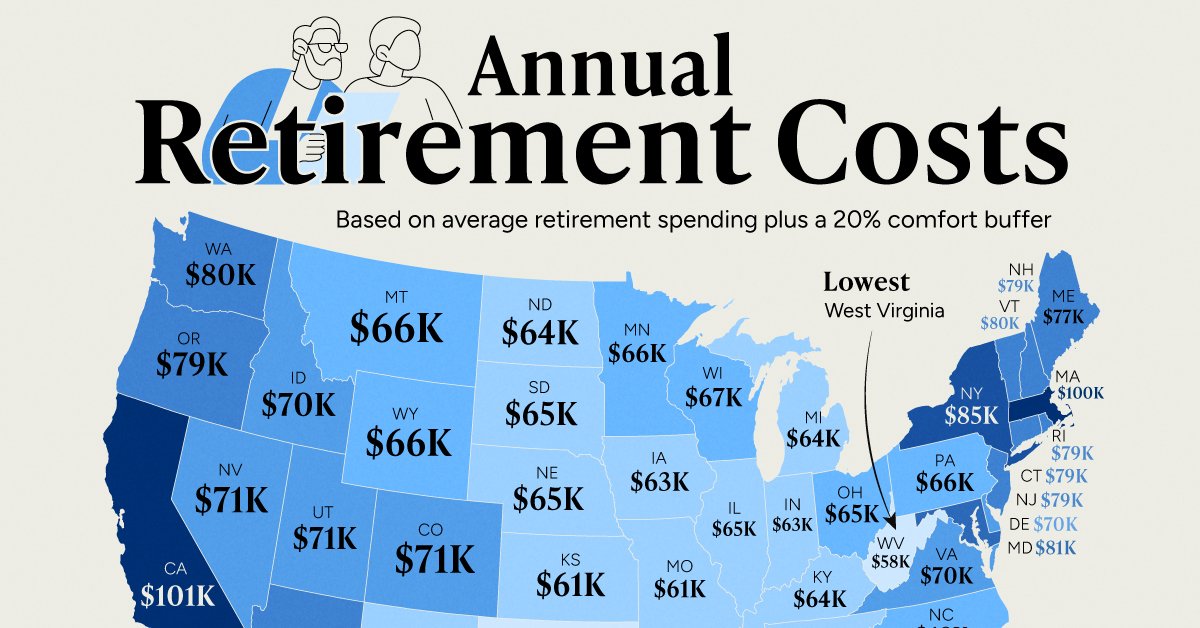
Retirement costs can vary dramatically depending on where you live in the United States.
While some states offer an affordable path to a comfortable retirement, others demand six-figure annual budgets. This infographic maps the annual cost of retirement across all 50 U.S. states, revealing the most and least expensive places for retirees.
Data and Methodology
The data for this visualization comes from GOBankingRates.
They analyzed the following expenditures of Americans aged 65 and older, based on data sourced from the Bureau of Labor Statistics’ (BLS) most recent Consumer Expenditure Survey release for the full year of 2023:
 Annual spending on groceries, defined as “food at home”
 Annual spending on housing, defined as “shelter”
 Annual spending on transportation, defined as “gasoline, other fuels and motor oil” AND “other vehicle expenses”
 Annual spending on healthcare
 Annual spending on utilities, defined as “utilities, fuels, and public services”
 Overall average annual expenditures
Spending estimates were adjusted to the state level by multiplying each cost category by its corresponding cost of living index score in each state, sourced from the Missouri Economic Research and Information Center’s 2024 Q2 cost of living index data.
After calculating total consumption expenditures, an additional (7) savings buffer was calculated by assuming that total expenditures consume 80% of ones budget (50% for necessities and 30% for discretionary spending), with 20% left over for savings.
GOBankingRates then combined factors (6) and (7) and factored it out by 20 (assuming 20 years of retirement) to give (8) retirement savings needed to live comfortably. All data was collected on and up to date as of Oct. 1, 2024.
| State | Total Expenditures | 20% Comfort Buffer |
Annual Retirement Cost |
|---|---|---|---|
| West Virginia | $48,492 | $9,698 | $58,190 |
| Oklahoma | $49,996 | $9,999 | $59,995 |
| Kansas | $50,517 | $10,103 | $60,620 |
| Alabama | $50,980 | $10,196 | $61,176 |
| Mississippi | $51,096 | $10,219 | $61,315 |
| Arkansas | $51,211 | $10,242 | $61,454 |
| Missouri | $51,211 | $10,242 | $61,454 |
| Iowa | $52,137 | $10,427 | $62,565 |
| Indiana | $52,253 | $10,451 | $62,704 |
| Tennessee | $52,253 | $10,451 | $62,704 |
| Georgia | $52,832 | $10,566 | $63,398 |
| Michigan | $53,121 | $10,624 | $63,745 |
| Louisiana | $53,295 | $10,659 | $63,954 |
| Texas | $53,468 | $10,694 | $64,162 |
| Kentucky | $53,584 | $10,717 | $64,301 |
| North Dakota | $53,700 | $10,740 | $64,440 |
| Illinois | $53,989 | $10,798 | $64,787 |
| Nebraska | $54,047 | $10,809 | $64,856 |
| South Dakota | $54,047 | $10,809 | $64,856 |
| New Mexico | $54,163 | $10,833 | $64,995 |
| Ohio | $54,394 | $10,879 | $65,273 |
| Montana | $54,741 | $10,948 | $65,689 |
| Minnesota | $54,857 | $10,971 | $65,828 |
| Wyoming | $55,031 | $11,006 | $66,037 |
| Pennsylvania | $55,320 | $11,064 | $66,384 |
| Wisconsin | $56,130 | $11,226 | $67,356 |
| South Carolina | $56,477 | $11,295 | $67,773 |
| North Carolina | $56,998 | $11,400 | $68,398 |
| Delaware | $58,387 | $11,677 | $70,064 |
| Idaho | $58,503 | $11,701 | $70,203 |
| Virginia | $58,618 | $11,724 | $70,342 |
| Colorado | $58,908 | $11,782 | $70,689 |
| Nevada | $59,428 | $11,886 | $71,314 |
| Utah | $59,544 | $11,909 | $71,453 |
| Florida | $59,660 | $11,932 | $71,592 |
| Arizona | $63,942 | $12,788 | $76,730 |
| Maine | $64,405 | $12,881 | $77,286 |
| Connecticut | $65,504 | $13,101 | $78,605 |
| Rhode Island | $65,620 | $13,124 | $78,744 |
| New Hampshire | $65,736 | $13,147 | $78,883 |
| New Jersey | $65,794 | $13,159 | $78,952 |
| Oregon | $66,025 | $13,205 | $79,230 |
| Vermont | $66,372 | $13,274 | $79,647 |
| Washington | $66,604 | $13,321 | $79,925 |
| Maryland | $67,240 | $13,448 | $80,688 |
| New York | $71,233 | $14,247 | $85,480 |
| Alaska | $72,390 | $14,478 | $86,868 |
| Massachusetts | $83,501 | $16,700 | $100,201 |
| California | $83,906 | $16,781 | $100,687 |
| Hawaii | $107,746 | $21,549 | $129,296 |
 Hawaii Tops the List
Hawaii ranks as the most expensive state to retire, with average annual expenditures reaching $129,296. This high cost is largely driven by steep prices for housing, groceries, and healthcare.
According to U.S. News & World Report, Hawaii consistently ranks near the top for quality of life—but retirees must be prepared for a financial commitment nearly double that of more affordable states.
 Affordable Living in the Midwest and South
Retirees on a budget often find the best value in West Virginia, Oklahoma, and Kansas, where average annual retirement costs remain around $50,000 annually.
These states benefit from significantly lower housing prices, modest property taxes, and minimal day-to-day expenses.
 High Costs in the Northeast and West Coast
Retiring in Massachusetts, California, and New York comes at a premium—residents in these states will spend over $70,000 per year to maintain a comfortable lifestyle. In a similar analysis by GOBankingRates, this could work out to around $1.3 to $1.6 million in total savings needed.
These states combine high housing costs, elevated healthcare expenses, and often steeper taxes. In fact, New York has the highest tax burden of any state.
Learn More on the Voronoi App 
Want to retire outside of the U.S.? Check out The Best Countries to Retire In on Voronoi, the new app from Visual Capitalist.