Charted: Getting to Know the STOXX Europe 600
Europe is an economic powerhouse, encompassing nearly $40 trillion in GDP and 750 million people.
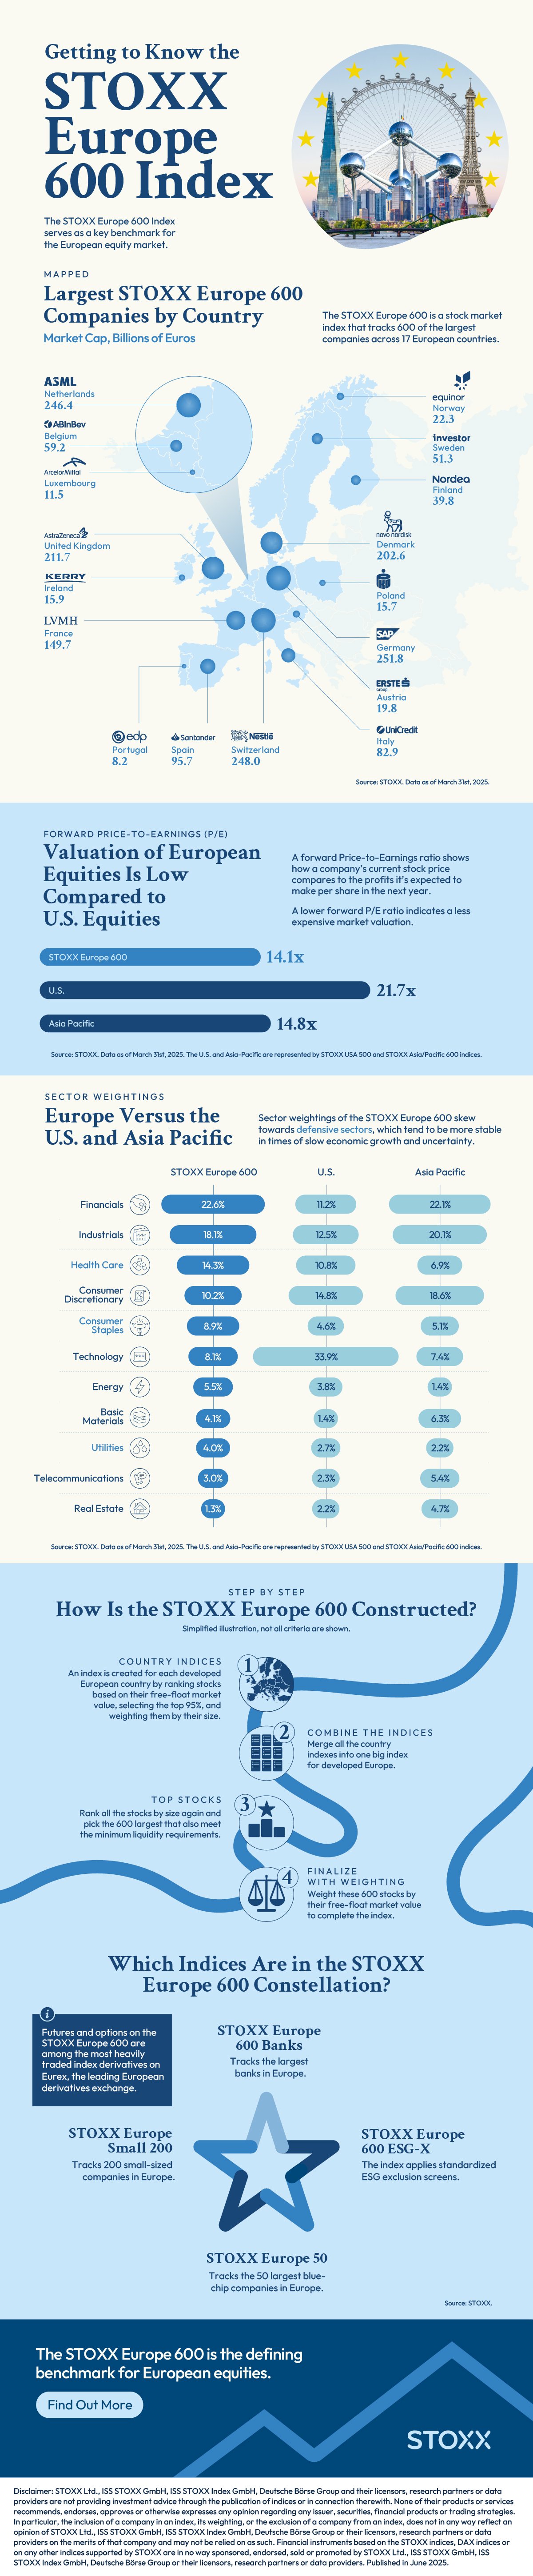
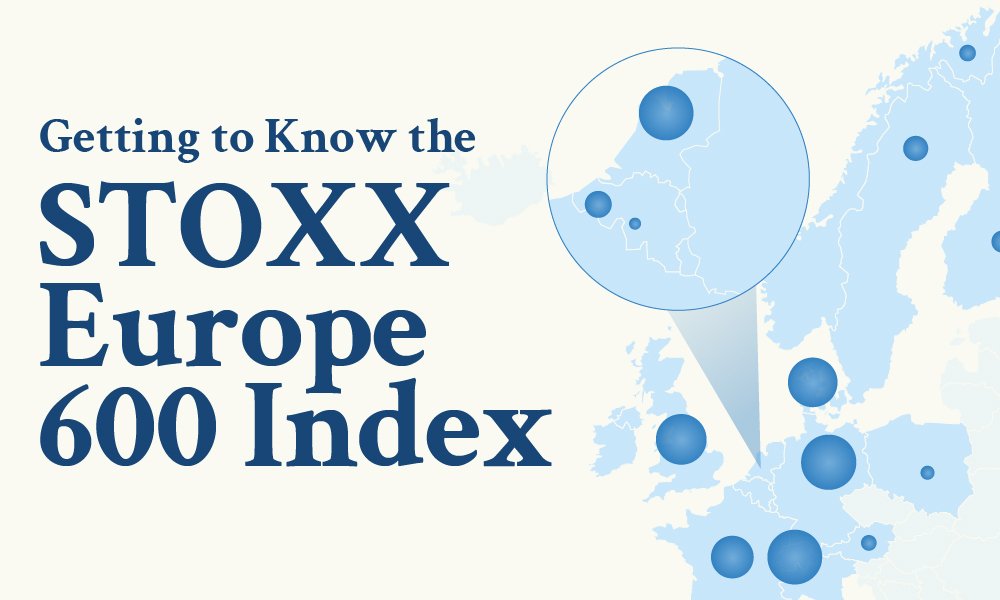
This visualization, created in partnership with STOXX, provides visual context to its European large-cap benchmark, an index that serves as a key benchmark for European equities.
Powerhouses: Europe’s Largest Companies by Country
The STOXX Europe 600 is a stock market index that tracks 600 of the largest companies across 17 European countries. Which companies take the top spot by country?
The top three biggest players are Germany’s SAP (free-float market capitalization: $251.8 billion), Switzerland’s Nestle ($248.0 billion), and the Netherlands’ ASML Holdings ($246.4 billion)—a leading semiconductor company.
| Country | Company | Free-Float Market Capitalization (€ billions) |
|---|---|---|
 Germany Germany |
SAP | 251.8 |
 Switzerland Switzerland |
Nestlé | 248.0 |
 Netherlands Netherlands |
ASML Holding | 246.4 |
 United Kingdom United Kingdom |
AstraZeneca | 211.7 |
 Denmark Denmark |
Novo Nordisk B | 202.6 |
 France France |
LVMH Moët Hennessy | 149.7 |
 Spain Spain |
Banco Santander | 95.7 |
 Italy Italy |
UniCredit | 82.9 |
 Belgium Belgium |
Anheuser-Busch InBev | 59.2 |
 Sweden Sweden |
Investor B | 51.3 |
 Finland Finland |
Nordea Bank | 39.8 |
 Norway Norway |
Equinor | 22.3 |
 Austria Austria |
Erste Group Bank | 19.8 |
 Ireland Ireland |
Kerry Group | 15.9 |
 Poland Poland |
PKO Bank | 15.7 |
 Luxembourg Luxembourg |
ArcelorMittal | 11.5 |
 Portugal Portugal |
EDP Energias de Portugal | 8.2 |
The UK’s AstraZeneca ($211.7 billion) and Denmark’s Novo Nordisk ($202.6 billion)—two heavyweights in the pharmaceutical space—take up the next spots.
On Sale: Favorable Valuations
Investors commonly use forward price-to-earnings (P/E) ratios to measure stock or index valuations. The ratio compares a company’s current stock price to its expected earnings per share over the next year. A lower forward P/E ratio indicates a less expensive market valuation.
| Index | Forward P/E ratio |
|---|---|
| STOXX Europe 600 | 14.1 |
| STOXX USA 500 | 21.7 |
| STOXX Asia/Pacific 600 | 14.8 |
The STOXX Europe 600 has a P/E ratio below its peers. Its P/E ratio sits at 14.1 versus 21.7 for the U.S. and 14.8 for Asia-Pacific.
Defensive Tilt: Sector Weightings
Another key difference between the STOXX Europe 600 and its U.S. and Asia-Pac counterparts is its defensive sector tilt. This positioning helps the index deliver steadier performance during periods of economic uncertainty and slowdowns.
| Sector | STOXX Europe 600 | STOXX USA 500 | STOXX Asia/Pacific 600 |
|---|---|---|---|
| Financials | 22.6% | 11.2% | 22.1% |
| Industrials | 18.1% | 12.5% | 20.1% |
| Health Care | 14.3% | 10.8% | 6.9% |
| Consumer Discretionary | 10.2% | 14.8% | 18.6% |
| Consumer Staples | 8.9% | 4.6% | 5.1% |
| Technology | 8.1% | 33.9% | 7.4% |
| Energy | 5.5% | 3.8% | 1.4% |
| Basic Materials | 4.1% | 1.4% | 6.3% |
| Utilities | 4.0% | 2.7% | 2.2% |
| Telecommunications | 3.0% | 2.3% | 5.4% |
| Real Estate | 1.3% | 2.2% | 4.7% |
The STOXX Europe 600 has higher weighting of healthcare (14.3% versus 10.8% for the U.S. and 6.9% for Asia-Pac), consumer staples (8.9% versus 4.6% and 5.1%), and utilities (4.0% versus 2.7% and 2.2%).
Learn More About the STOXX Europe 600
The STOXX Europe 600 is the defining benchmark for European equities. And, beyond the headline index, there are several other indices in the STOXX Europe 600 constellation investors can consider, including ones that focus on banks, ESG leaders, small-caps, and blue chips.

Find Out More About the STOXX Europe 600
-
 Markets1 year ago
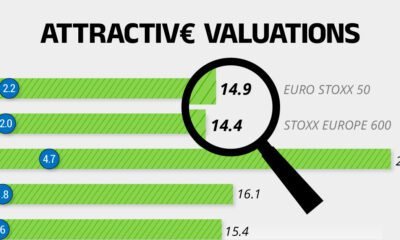
The European Stock Market: Attractive Valuations Offer Opportunities
On average, the European stock market has valuations that are nearly 50% lower than U.S. valuations. But how can you access the market?
-
 Investor Education1 year ago
How Investors Can Integrate Biodiversity into Their Financial Strategies
Despite contributing over half of global GDP, biodiversity is under severe pressure, and key species and ecosystems continue to be lost.


var disqus_shortname = “visualcapitalist.disqus.com”;
var disqus_title = “Charted: Getting to Know the STOXX Europe 600”;
var disqus_url = “https://www.visualcapitalist.com/sp/charted-getting-to-know-the-stoxx-europe-600-stx03/”;
var disqus_identifier = “visualcapitalist.disqus.com-178708”;