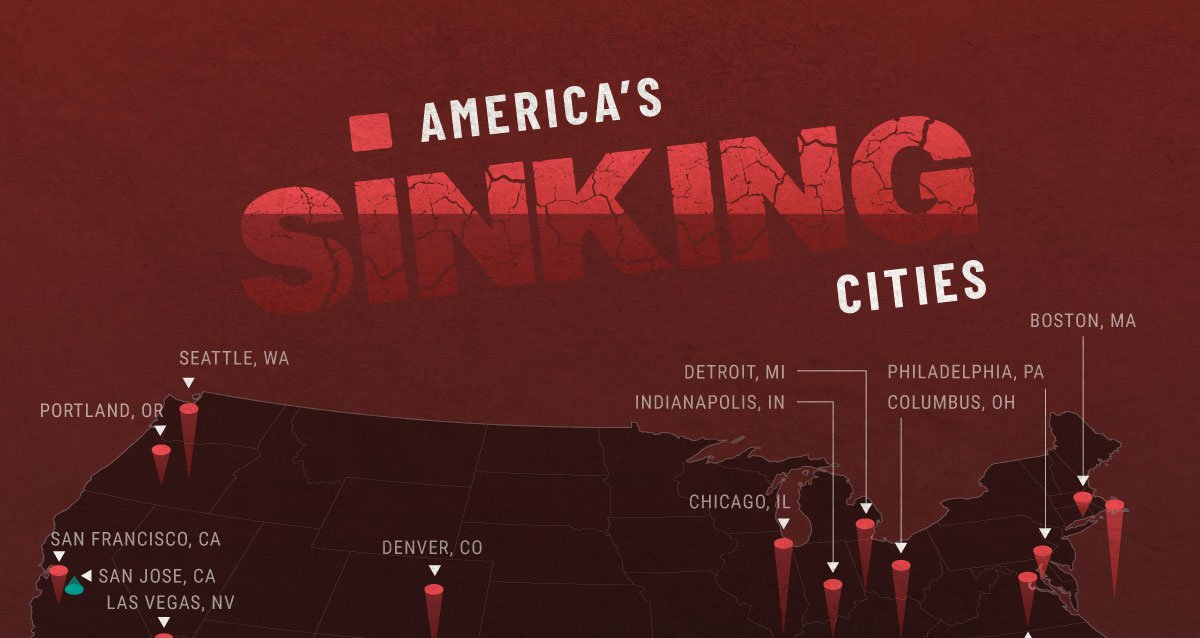
Land Subsidence Across U.S. Cities
This was originally posted on our Voronoi app. Download the app for free on iOS or Android and discover incredible data-driven charts from a variety of trusted sources.
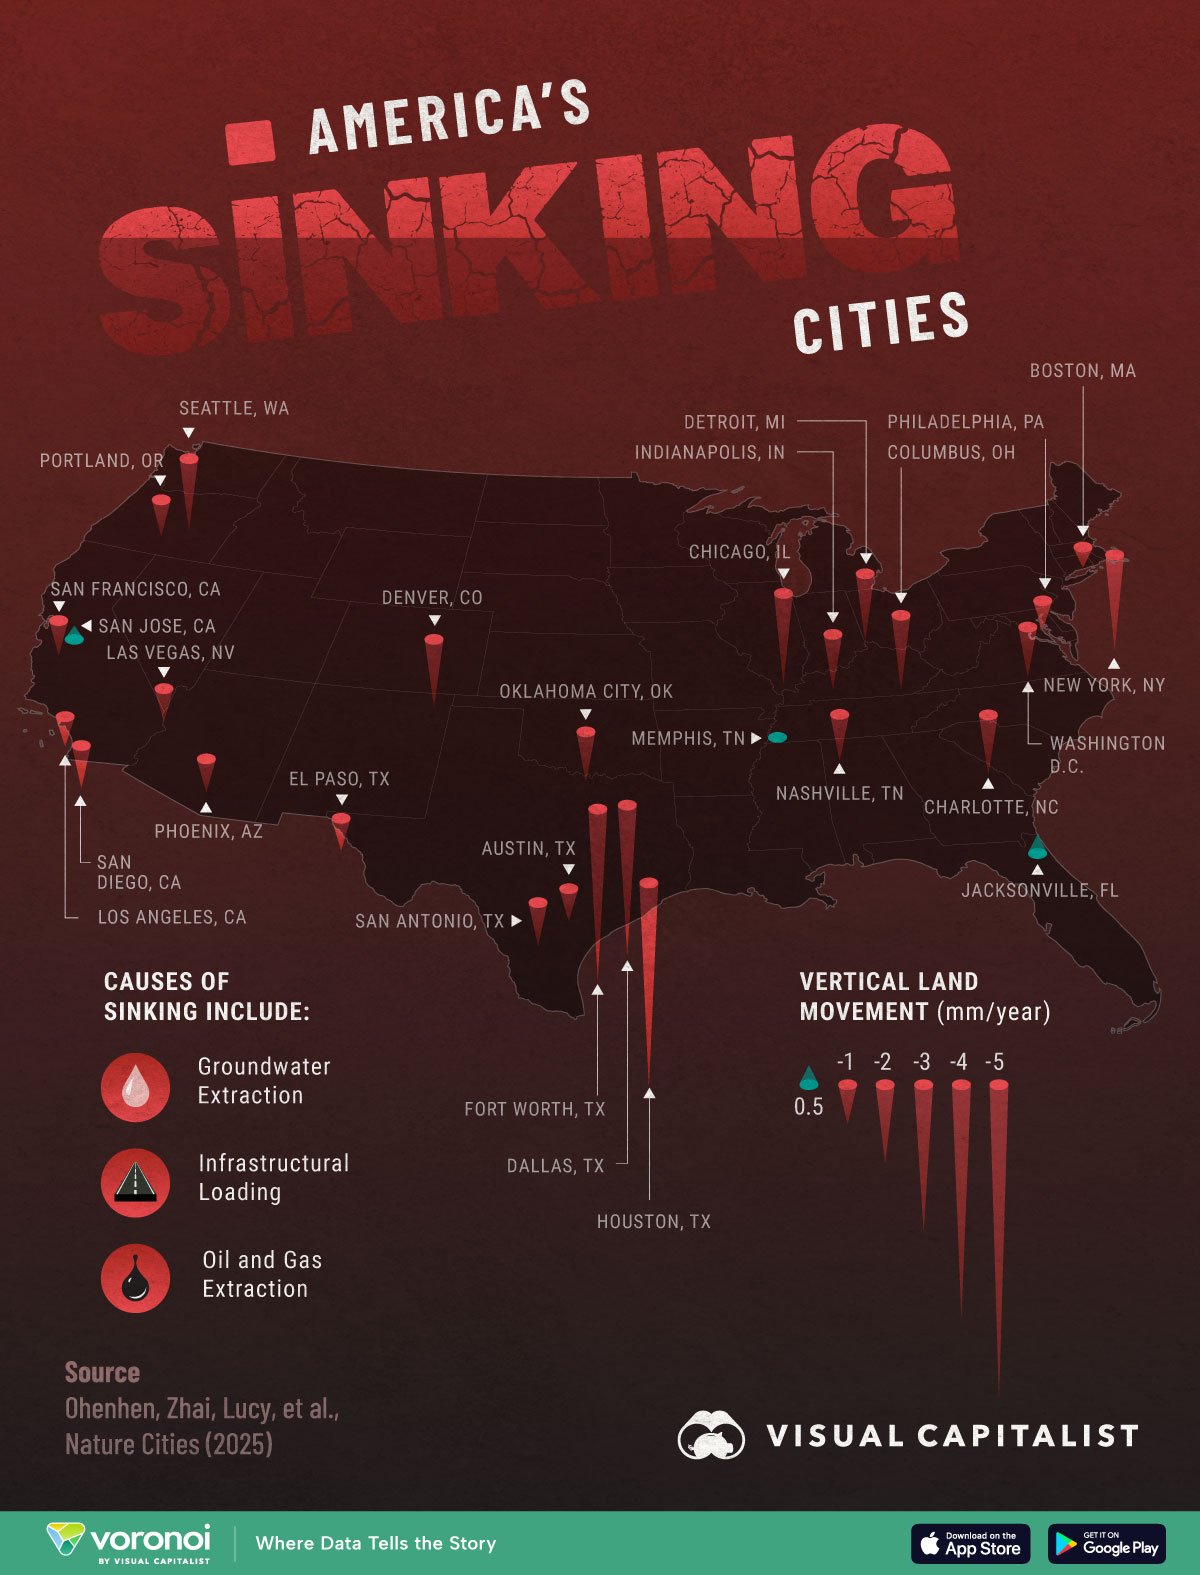
Across the U.S., major urban centers are experiencing significant land subsidence, a.k.a the sinking of land.
This map visualizes the average vertical land movement within 28 of the largest U.S. cities from 2015 to 2021, measured in milimeters per year.
Data comes from a 2025 Nature Cities study titled “Land subsidence risk to infrastructure in US metropolises” by Ohenhen, Zhai, Lucy, et al.
Which U.S. City is Sinking the Most?
Below, we show the average vertical land movement within 28 of the largest U.S. cities from 2015 to 2021, measured in millimeters per year.
| City | State | Vertical land movement (mm/year) |
|---|---|---|
| Houston | Texas | -5.216 |
| Fort Worth | Texas | -4.366 |
| Dallas | Texas | -3.846 |
| New York | New York | -2.430 |
| Chicago | Illinois | -2.323 |
| Columbus | Ohio | -1.934 |
| Seattle | Washington | -1.847 |
| Detroit | Michigan | -1.726 |
| Denver | Colorado | -1.714 |
| Charlotte | North Carolina | -1.507 |
| Indianapolis | Indiana | -1.423 |
| Washington | District of Columbia | -1.283 |
| Oklahoma City | Oklahoma | -1.283 |
| Nashville | Tennessee | -1.133 |
| San Antonio | Texas | -1.099 |
| San Diego | California | -1.076 |
| Portland | Oregon | -0.922 |
| San Francisco | California | -0.857 |
| Phoenix | Arizona | -0.846 |
| Las Vegas | Nevada | -0.841 |
| Austin | Texas | -0.792 |
| El Paso | Texas | -0.754 |
| Philadelphia | Pennsylvania | -0.735 |
| Los Angeles | California | -0.729 |
| Boston | Massachusetts | -0.478 |
| Memphis | Tennessee | 0.006 |
| San Jose | California | 0.219 |
| Jacksonville | Florida | 0.452 |
A recent study found that 25 of the 28 largest U.S. metropolitan areas are sinking each year, with cities in Texas experiencing some of the most severe land subsidence.
Out of the cities studied, Houston was the city experiencing the most drastic subsidence, sinking 5.216 milimeters per year on average.
This gradual sinking can worsen the impacts of sea-level rise, increase flood risk, and place additional stress on urban infrastructure, particularly in densely developed areas.
The primary cause of this subsidence is groundwater extraction, though other contributing factors include the weight of urban development, oil and gas extraction, and glacial isostatic adjustment—a slow shift in the Earth’s surface due to the long-term melting of ancient ice sheets.
The study authors estimate that a total land area of 17,900 sq. km. is sinking across these 28 cities.
Learn More on the Voronoi App 
To learn about sinking cities, check out this graphic by Planet Anomaly that visualizes the fastest-sinking coastal cities.