Since plastic began to be mass-produced in the 1950s, the material has been building up in the environment and in people’s bodies. These six graphs illustrate just how bad the problem has gotten, and why delegates from more than 170 countries have committed to negotiating a global, legally binding treaty to “end plastic pollution.” The second part of the fifth round of talks began on Tuesday and is scheduled to run through August 14 in Geneva, Switzerland.
.plastic-production {
–color-primary: #3c3830;
–color-secondary: #777;
–color-orange: #F79945;
–color-turquoise: #12A07F;
–color-fuchsia: #AC00E8;
–color-cobalt: #3977F3;
–color-earth: #3c3830;
–typography-primary: “PolySans”, Arial, sans-serif;
–typography-secondary: “Basis Grotesque”, Arial, sans-serif;
–spacing-base: 10px;
box-sizing: border-box;
font-family: var(–typography-secondary);
margin: 1.5rem auto;
padding: 0;
position: relative;
width: 100%;
}
.plastic-production * { box-sizing: border-box; }
.plastic-production__title {
font-family: var(–typography-primary);
font-size: 24px;
margin: var(–spacing-base) 0;
}
.plastic-production__subtitle {
font-family: var(–typography-secondary);
color: var(–color-primary);
font-size: 18px;
margin: 0 0 var(–spacing-base);
}
.plastic-production__axis-label {
color: var(–color-primary);
font-size: 14px;
}
.axis-grid line {
stroke: #e0e0e0;
stroke-opacity: 0.7;
shape-rendering: crispEdges;
}
.axis-grid .domain { stroke: none; }
.line { fill: none; stroke-width: 3.5px; }
.line–projected { stroke-dasharray: 6 4; }
.pulsing-dot { stroke: white; stroke-width: 1.7px; }
.data-label {
font-family: var(–typography-secondary);
font-size: 11px;
fill: var(–color-primary);
}
.plastic-production__footer { display: flex; justify-content: space-between; align-items: flex-end; margin-top: 8px; }
.plastic-production__credits { display: flex; flex-direction: column; }
.plastic-production__source { color: var(–color-secondary); font-size: 12px; margin-top: 0; display: inline-block; }
.plastic-production__credit { color: var(–color-secondary); font-size: 12px; margin-top: 3px; font-style: italic; font-weight: bold; display: inline-block; }
.plastic-production__logo { height: 20px; width: auto; margin-left: auto; padding-right: 20px; margin-right: 0; margin-bottom: 4px; }
Plastic production is increasing exponentially
Plastic production from 1950 to 2019, with projected growth to 2060, metric tons
(function() {
const INIT_KEY = ‘__grist_plastic_production_initialized__’;
if (window[INIT_KEY]) { return; }
window[INIT_KEY] = true;
const COLORS = {
TEXT: ‘var(–color-primary)’,
LINE: ‘var(–color-orange)’
};
const initialSvgHeight = 400;
const svg = d3.select(‘#line-chart’);
const formatCompactWithB = (n) => d3.format(‘~s’)(n).replace(‘G’, ‘B’);
const rawData = [
{ year: 1950, amount: 2000000 },
{ year: 1970, amount: 35000000 },
{ year: 2019, amount: 460000000 },
{ year: 2060, amount: 1230000000 }
];
const data = rawData.map(d => ({ year: new Date(+d.year, 0, 1), amount: +d.amount }));
const margin = { top: 20, right: 20, bottom: 36, left: window.innerWidth x(d.year))
.y(d => y(d.amount));
x.domain(d3.extent(data, d => d.year));
y.domain([0, d3.max(data, d => d.amount)]);
svg.attr(‘height’, initialSvgHeight);
// Compute a dynamic year interval for ticks to avoid label collisions
const startYear = data[0].year.getFullYear();
const endYear = data[data.length – 1].year.getFullYear();
const totalYears = endYear – startYear;
const minLabelSpacingPx = 60; // desired minimum pixel spacing between x-axis labels
const maxTicks = Math.max(2, Math.floor(width / minLabelSpacingPx));
const approxYearsPerTick = Math.max(1, Math.ceil(totalYears / maxTicks));
const niceSteps = [1, 2, 5, 10, 20, 25, 50, 100];
const stepYears = niceSteps.find(s => s >= approxYearsPerTick) || niceSteps[niceSteps.length – 1];
const xTickInterval = d3.timeYear.every(stepYears);
// Gridlines
svg.append(‘g’)
.attr(‘class’, ‘axis-grid’)
.attr(‘transform’, `translate(${margin.left},${height + margin.top})`)
.call(d3.axisBottom(x).ticks(xTickInterval).tickSize(-height).tickFormat(”));
svg.append(‘g’)
.attr(‘class’, ‘axis-grid’)
.attr(‘transform’, `translate(${margin.left},${margin.top})`)
.call(d3.axisLeft(y).ticks(5).tickSize(-width).tickFormat(”));
const xAxis = g => g
.attr(‘transform’, `translate(${margin.left},${height + margin.top})`)
.call(d3.axisBottom(x).ticks(xTickInterval).tickFormat(d3.timeFormat(‘%Y’)))
.selectAll(‘text’)
.attr(‘class’, ‘plastic-production__axis-label’)
.style(‘fill’, COLORS.TEXT)
.style(‘text-anchor’, ‘middle’);
const yAxis = g => g
.attr(‘transform’, `translate(${margin.left},${margin.top})`)
.call(d3.axisLeft(y).ticks(5).tickFormat(d => formatCompactWithB(d)))
.selectAll(‘text’)
.attr(‘class’, ‘plastic-production__axis-label’)
.style(‘fill’, COLORS.TEXT);
svg.append(‘g’).call(xAxis);
svg.append(‘g’).call(yAxis);
const chart = svg.append(‘g’).attr(‘transform’, `translate(${margin.left},${margin.top})`);
// Image area fill under the line
const area = d3.area()
.x(d => x(d.year))
.y0(y(0))
.y1(d => y(d.amount));
const defs = chart.append(‘defs’);
const grayFilter = defs.append(‘filter’).attr(‘id’, ‘imgGreyscale’);
grayFilter.append(‘feColorMatrix’).attr(‘type’, ‘saturate’).attr(‘values’, ‘0’);
const areaMask = defs.append(‘mask’).attr(‘id’, ‘productionAreaMask’);
areaMask.append(‘path’)
.attr(‘d’, area(data))
.attr(‘fill’, ‘white’);
chart.append(‘image’)
.attr(‘xlink:href’, ‘https://grist.org/wp-content/uploads/2025/08/killari-hotaru-BAXJ93VVrXM-unsplash.jpg’)
.attr(‘x’, 0)
.attr(‘y’, 0)
.attr(‘width’, width)
.attr(‘height’, height)
.attr(‘preserveAspectRatio’, ‘xMidYMid slice’)
.attr(‘mask’, ‘url(#productionAreaMask)’)
.attr(‘filter’, ‘url(#imgGreyscale)’);
// Optional translucent color overlay for the area
chart.append(‘path’)
.datum(data)
.attr(‘d’, area)
.attr(‘fill’, COLORS.LINE)
.style(‘opacity’, 0.65);
// Draw historical (solid) and projected (dashed) segments
const indexOf2019 = data.findIndex(d => d.year.getFullYear() === 2019);
const historicalData = indexOf2019 >= 0 ? data.slice(0, indexOf2019 + 1) : data;
const projectedData = indexOf2019 >= 0 ? data.slice(indexOf2019) : [];
chart.append(‘path’)
.datum(historicalData)
.attr(‘class’, ‘line’)
.attr(‘d’, line)
.style(‘stroke’, COLORS.LINE);
if (projectedData.length > 1) {
chart.append(‘path’)
.datum(projectedData)
.attr(‘class’, ‘line line–projected’)
.attr(‘d’, line)
.style(‘stroke’, COLORS.LINE);
}
const last = data[data.length – 1];
const dotRadius = 5;
const circle = chart.append(‘circle’)
.attr(‘class’, ‘pulsing-dot’)
.attr(‘cx’, x(last.year))
.attr(‘cy’, y(last.amount))
.attr(‘r’, dotRadius)
.style(‘fill’, COLORS.LINE);
function animatePulse() {
circle.transition().duration(750).attr(‘r’, dotRadius * 1.2)
.transition().duration(750).attr(‘r’, dotRadius).on(‘end’, animatePulse);
}
animatePulse();
const label = chart.append(‘text’)
.attr(‘class’, ‘data-label’)
.attr(‘y’, y(last.amount) + 4)
.style(‘fill’, COLORS.LINE)
.text(`${formatCompactWithB(last.amount)} (projected)`);
const rightX = x(last.year) + 8 + dotRadius;
const labelWidth = label.node().getComputedTextLength();
if (rightX + labelWidth > width) {
label
.attr(‘text-anchor’, ‘end’)
.attr(‘x’, x(last.year) – 8 – dotRadius);
} else {
label
.attr(‘text-anchor’, ‘start’)
.attr(‘x’, rightX);
}
}
if (document.readyState === ‘loading’) {
document.addEventListener(‘DOMContentLoaded’, renderChart);
} else {
renderChart();
}
window.addEventListener(‘resize’, renderChart);
})();
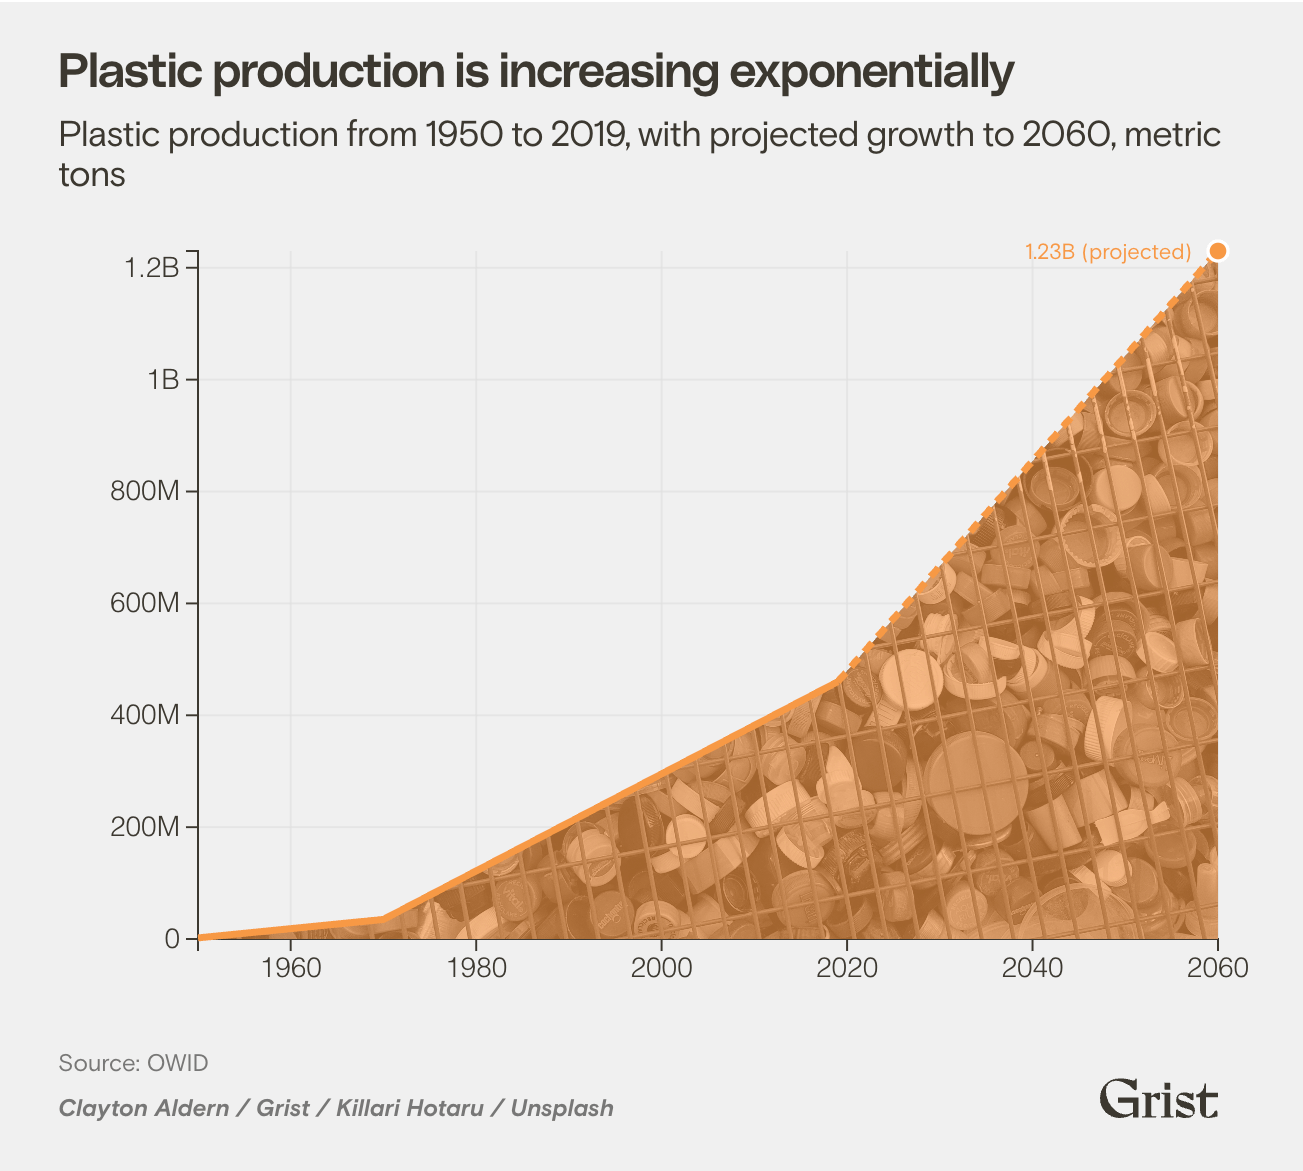
The world produced 2 million metric tons of plastic in 1950. That number doubled to 4 million by 1955, then doubled again to 8 million in 1960, and has been increasing exponentially ever since. By 2019, the world was producing about 460 million metric tons of plastic every year — about the same weight as as 88 Great Pyramids of Giza.
Fossil fuel companies plan to produce even more plastic in the coming decades. According to a 2022 estimate from the Organisation for Economic Cooperation and Development, or OECD — an intergovernmental group that publishes reports and policy analyses — global production will reach 1.2 billion metric tons by 2060 unless some sort of restrictions are introduced. That’s more than 3,600 times the weight of the Empire State Building.
.plastic-waste-management {
–color-primary: #3c3830;
–color-secondary: #777;
–color-orange: #F79945;
–color-turquoise: #12A07F;
–color-fuchsia: #AC00E8;
–color-cobalt: #3977F3;
–color-earth: #3c3830;
–typography-primary: “PolySans”, Arial, sans-serif;
–typography-secondary: “Basis Grotesque”, Arial, sans-serif;
–spacing-base: 10px;
box-sizing: border-box;
font-family: var(–typography-secondary);
margin: 1.5rem auto;
padding: 0;
position: relative;
width: 100%;
}
.plastic-waste-management * { box-sizing: border-box; }
.plastic-waste-management__title { font-family: var(–typography-primary); font-size: 24px; margin: var(–spacing-base) 0; }
.plastic-waste-management__subtitle { font-family: var(–typography-secondary); color: var(–color-primary); font-size: 18px; margin: 0 0 var(–spacing-base); }
.plastic-waste-management__footer { display: flex; justify-content: space-between; align-items: flex-end; margin-top: 8px; gap: 16px; }
.plastic-waste-management__credits { display: flex; flex-direction: column; }
.plastic-waste-management__source { color: var(–color-secondary); font-size: 12px; left: 0; margin-top: 0; position: relative; display: inline-block; max-width: min(520px, calc(100% – 50px)); }
.plastic-waste-management__credit { color: var(–color-secondary); font-size: 12px; left: 0; margin-top: 3px; position: relative; font-style: italic; font-weight: bold; display: inline-block; max-width: min(520px, calc(100% – 50px)); }
.plastic-waste-management__logo { height: auto; max-width: 62px; min-width: 50px; margin-left: auto; padding-right: 0; margin-right: 0; margin-bottom: 4px; align-self: flex-end; transform: translateX(-5px); }
.treemap-label { font-family: var(–typography-secondary); font-size: 12px; fill: #fff; font-weight: bold; pointer-events: none; }
.legend { font-family: var(–typography-secondary); font-size: 12px; }
.legend-item { display: none; }
.legend-color-box { display: none; }
Most plastic never gets recycled
Share of plastic recycled, compared to other waste management strategies
(function() {
const INIT_KEY = ‘__grist_plastic_waste_management_initialized__’;
if (window[INIT_KEY]) { return; }
window[INIT_KEY] = true;
const COLORS = {
TEXT: ‘var(–color-primary)’,
RECT_COLORS: [‘var(–color-turquoise)’, ‘var(–color-orange)’, ‘var(–color-fuchsia)’, ‘var(–color-cobalt)’]
};
const svg = d3.select(‘#treemap’);
const initialHeight = 420;
const TILE_RADIUS = 4;
const rawData = [
{ type: ‘Recycled’, percent: 0.09 },
{ type: ‘Incinerated’, percent: 0.19 },
{ type: ‘Mismanaged’, percent: 0.24 },
{ type: ‘Landfilled’, percent: 0.49 }
];
const data = { name: ‘waste’, children: rawData.map(d => ({ name: d.type, value: d.percent })) };
function renderChart() {
svg.selectAll(‘*’).remove();
const node = svg.node();
const styleWidth = parseInt(svg.style(‘width’));
const containerWidth = node ? node.getBoundingClientRect().width : (isNaN(styleWidth) ? 600 : styleWidth);
const width = containerWidth;
const height = initialHeight;
svg.attr(‘height’, initialHeight);
// Decide label orientation after treemap computes tile sizes so it stays in sync with layout
let labelVertical;
const root = d3.hierarchy(data).sum(d => d.value);
d3.treemap().size([width, height]).paddingInner(4)(root);
const minTileWidth = d3.min(root.leaves(), d => d.x1 – d.x0);
labelVertical = minTileWidth d.type))
.range(COLORS.RECT_COLORS);
const nodes = svg.selectAll(‘g’)
.data(root.leaves())
.enter().append(‘g’)
.attr(‘transform’, `translate(0,0)`);
// Build unique clipPaths for each node and place images
const defs = svg.append(‘defs’);
const grayFilter = defs.append(‘filter’).attr(‘id’, ‘wasteGreyscale’);
grayFilter.append(‘feColorMatrix’).attr(‘type’, ‘saturate’).attr(‘values’, ‘0’);
nodes.each(function(d, i) {
const id = `tmClip-${i}`;
defs.append(‘clipPath’)
.attr(‘id’, id)
.attr(‘clipPathUnits’, ‘userSpaceOnUse’)
.append(‘rect’)
.attr(‘x’, d.x0)
.attr(‘y’, d.y0)
.attr(‘width’, d.x1 – d.x0)
.attr(‘height’, d.y1 – d.y0)
.attr(‘rx’, TILE_RADIUS)
.attr(‘ry’, TILE_RADIUS);
const imgList = [
‘https://grist.org/wp-content/uploads/2025/08/rea-tekoro-fLzDDV9JYjc-unsplash.jpg’,
‘https://grist.org/wp-content/uploads/2025/08/emily-bernal-r2F5ZIEUPtk-unsplash.jpg’,
‘https://grist.org/wp-content/uploads/2025/08/naja-bertolt-jensen-bN_pgc53NO4-unsplash.jpg’,
‘https://grist.org/wp-content/uploads/2025/08/marc-newberry-9vcEn3BJyy8-unsplash.jpg’
];
const imgHref = imgList[i % imgList.length];
// Append image inside this node group so later rect overlay draws above it
d3.select(this)
.append(‘image’)
.attr(‘xlink:href’, imgHref)
.attr(‘x’, d.x0)
.attr(‘y’, d.y0)
.attr(‘width’, d.x1 – d.x0)
.attr(‘height’, d.y1 – d.y0)
.attr(‘preserveAspectRatio’, ‘xMidYMid slice’)
.attr(‘clip-path’, `url(#${id})`)
.attr(‘filter’, ‘url(#wasteGreyscale)’);
});
nodes.append(‘rect’)
.attr(‘x’, d => d.x0)
.attr(‘y’, d => d.y0)
.attr(‘width’, d => d.x1 – d.x0)
.attr(‘height’, d => d.y1 – d.y0)
.attr(‘rx’, TILE_RADIUS)
.attr(‘ry’, TILE_RADIUS)
.attr(‘fill’, d => color(d.data.name))
.style(‘opacity’, 0.65);
nodes.append(‘text’)
.attr(‘class’, ‘treemap-label’)
.each(function(d) {
const rectWidth = d.x1 – d.x0;
const rectHeight = d.y1 – d.y0;
const isMobile = labelVertical;
let label = `${d.data.name} — ${d3.format(‘.0%’)(d.data.value)}`;
const self = d3.select(this);
if (isMobile) {
const leftPadding = TILE_RADIUS + 10;
const bottomPadding = 8;
const x = d.x0 + leftPadding;
const y = d.y1 – bottomPadding;
// Vertical label from bottom-left corner (viewport-based)
self
.attr(‘x’, x)
.attr(‘y’, y)
.style(‘text-anchor’, ‘start’)
.attr(‘transform’, `rotate(-90, ${x}, ${y})`);
// Approximate character fit along tile height
const approxCharPx = 7; // ~px/char for 12px font
const maxChars = Math.max(4, Math.floor((rectHeight – (bottomPadding + TILE_RADIUS)) / approxCharPx));
if (label.length > maxChars) label = label.slice(0, maxChars – 1) + ‘…’;
self.text(label);
} else {
// Horizontal label with width-based truncation
self
.attr(‘x’, d.x0 + 6)
.attr(‘y’, d.y0 + 16)
.style(‘text-anchor’, ‘start’);
self.text(label);
const maxWidth = rectWidth – 12;
while (this.getComputedTextLength() > maxWidth && label.length > 0) {
label = label.slice(0, -1);
self.text(label + ‘…’);
}
}
});
}
if (document.readyState === ‘loading’) {
document.addEventListener(‘DOMContentLoaded’, renderChart);
} else {
renderChart();
}
window.addEventListener(‘resize’, renderChart);
})();
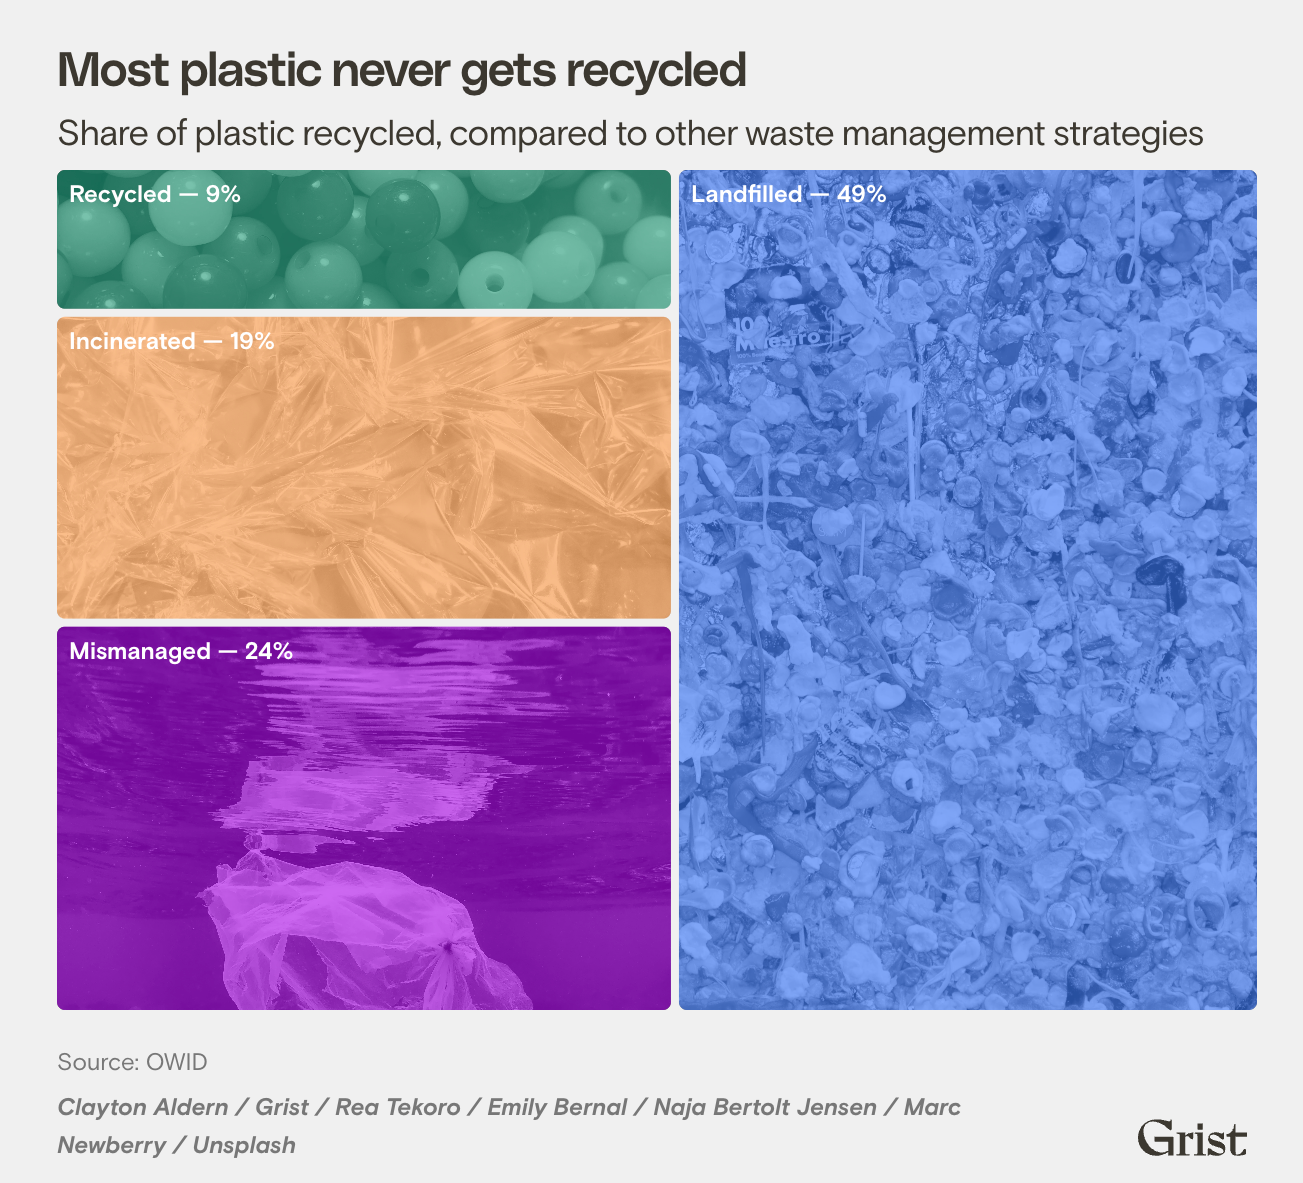
Skyrocketing plastic production has made life more convenient by making consumer goods and packaging lighter and cheaper. But it has also caused enormous waste management problems. Contrary to industry claims, plastic recycling does not work on a large scale: Only 9 percent of the plastic the world creates gets turned into a new product — and less than 1 percent is ever recycled more than once.
Most plastic — about 49 percent of it — is sent to landfills. Another 19 percent is burned in incinerators, and 22 percent is categorized by the OECD as “mismanaged” — a euphemism that means it’s burned in open pits, tossed into unofficial dumpsites, or littered into rivers and seas. Large pieces of plastic litter entangle and choke wildlife, and the small fragments that they break into — known as microplastics — leach hazardous chemicals that can further jeopardize animals and ecosystems.
.plastic-leakage {
–color-primary: #3c3830;
–color-secondary: #777;
–color-bar-fill: #12A07F;
–typography-primary: “PolySans”, Arial, sans-serif;
–typography-secondary: “Basis Grotesque”, Arial, sans-serif;
–spacing-base: 10px;
box-sizing: border-box;
font-family: var(–typography-secondary);
margin: 1.5rem auto;
padding: 0;
position: relative;
width: 100%;
}
.plastic-leakage * { box-sizing: border-box; }
.plastic-leakage__title { font-family: var(–typography-primary); font-size: 24px; margin: var(–spacing-base) 0; text-align: left; }
.plastic-leakage__subtitle { font-family: var(–typography-secondary); color: var(–color-primary); font-size: 18px; margin: 0 0 var(–spacing-base); text-align: left; }
.plastic-leakage__axis-label { color: var(–color-primary); font-size: 14px; }
.plastic-leakage__footer { display: flex; justify-content: space-between; align-items: flex-end; margin-top: 0px; }
.plastic-leakage__credits { display: flex; flex-direction: column; }
.plastic-leakage__source { color: var(–color-secondary); font-size: 12px; margin-top: 0; display: inline-block; }
.plastic-leakage__credit { color: var(–color-secondary); font-size: 12px; margin-top: 3px; font-style: italic; font-weight: bold; display: inline-block; }
.plastic-leakage__logo { height: 20px; width: auto; margin-left: auto; padding-right: 20px; margin-right: 0; margin-bottom: 4px; }
.bar-label { font-family: var(–typography-secondary); font-size: 12px; fill: var(–color-primary); text-anchor: middle; }
.axis-grid line { stroke: #e0e0e0; stroke-opacity: 0.7; shape-rendering: crispEdges; }
.axis-grid .domain { stroke: none; }
Plastic pollution could double by 2060 under business as usual
Plastic polluted into the environment in 2019, with projections for 2060 with and without stringent global action, metric tons
(function() {
const INIT_KEY = ‘__grist_plastic_leakage_initialized__’;
if (window[INIT_KEY]) { return; }
window[INIT_KEY] = true;
const COLORS = {
TEXT_COLOR: ‘var(–color-primary)’,
BAR_FILL_OPACITY: 0.65,
BAR_COLOR: ‘var(–color-bar-fill)’
};
const svg = d3.select(‘#leakage-bar-chart’);
const initialSvgHeight = 450;
const BAR_RADIUS = 4;
const formatCompactWithB = (n) => d3.format(‘~s’)(n).replace(‘G’, ‘B’);
const rawData = [
{ label: ‘2019’, amount: 22000000, ambition: ” },
{ label: ‘2060 (projected)’, amount: 44000000, ambition: ‘low’ },
{ label: ‘2060 (high ambition)’, amount: 6000000, ambition: ‘high’ }
];
const data = rawData;
const margin = { top: 20, right: 20, bottom: 50, left: window.innerWidth width) {
line.pop();
tspan.text(line.join(‘ ‘));
line = [word];
tspan = text.append(‘tspan’).attr(‘x’, 0).attr(‘y’, y).attr(‘dy’, ++lineNumber * (lineHeight / 14) + dy + ’em’).text(word);
}
}
});
}
function renderChart() {
svg.selectAll(‘*’).remove();
const node = svg.node();
const styleWidth = parseInt(svg.style(‘width’));
const containerWidth = node ? node.getBoundingClientRect().width : (isNaN(styleWidth) ? 600 : styleWidth);
const width = containerWidth – margin.left – margin.right;
const height = initialSvgHeight – margin.top – margin.bottom;
svg.attr(‘height’, initialSvgHeight);
const x = d3.scaleBand().domain(data.map(d => d.label)).range([0, width]).padding(0.25);
const y = d3.scaleLinear().domain([0, d3.max(data, d => d.amount) * 1.1]).range([height, 0]);
// grid
svg.append(‘g’)
.attr(‘class’, ‘axis-grid’)
.attr(‘transform’, `translate(${margin.left},${margin.top})`)
.call(d3.axisLeft(y).ticks(5).tickSize(-width).tickFormat(”));
const xAxis = g => {
g.attr(‘transform’, `translate(${margin.left},${height + margin.top})`)
.call(d3.axisBottom(x));
// Wrap tick labels on small widths
const maxWidth = Math.min(80, Math.max(48, width / data.length – 6));
g.selectAll(‘.tick text’)
.attr(‘class’, ‘plastic-leakage__axis-label’)
.style(‘fill’, COLORS.TEXT_COLOR)
.style(‘text-anchor’, ‘middle’)
.call(wrapSvgText, maxWidth, 14);
};
const yAxis = g => g
.attr(‘transform’, `translate(${margin.left},${margin.top})`)
.call(d3.axisLeft(y).ticks(5).tickFormat(d => formatCompactWithB(d)))
.selectAll(‘text’)
.attr(‘class’, ‘plastic-leakage__axis-label’)
.style(‘fill’, COLORS.TEXT_COLOR);
svg.append(‘g’).call(xAxis);
svg.append(‘g’).call(yAxis);
const chartGroup = svg.append(‘g’).attr(‘transform’, `translate(${margin.left},${margin.top})`);
// Image fill across all bars using a mask
const defs = chartGroup.append(‘defs’);
const grayFilter = defs.append(‘filter’).attr(‘id’, ‘leakageGreyscale’);
grayFilter.append(‘feColorMatrix’).attr(‘type’, ‘saturate’).attr(‘values’, ‘0’);
const barsMask = defs.append(‘mask’).attr(‘id’, ‘leakageBarsMask’);
data.forEach(d => {
barsMask.append(‘rect’)
.attr(‘x’, x(d.label))
.attr(‘y’, y(d.amount))
.attr(‘width’, x.bandwidth())
.attr(‘height’, height – y(d.amount))
.attr(‘rx’, BAR_RADIUS)
.attr(‘ry’, BAR_RADIUS)
.attr(‘fill’, ‘white’);
});
chartGroup.append(‘image’)
.attr(‘xlink:href’, ‘https://grist.org/wp-content/uploads/2025/08/flyd-aQkIlaNdeq4-unsplash.jpg’)
.attr(‘x’, 0)
.attr(‘y’, 0)
.attr(‘width’, width)
.attr(‘height’, height)
.attr(‘preserveAspectRatio’, ‘xMidYMid slice’)
.attr(‘mask’, ‘url(#leakageBarsMask)’)
.attr(‘filter’, ‘url(#leakageGreyscale)’);
chartGroup.selectAll(‘.bar’)
.data(data)
.enter().append(‘rect’)
.attr(‘class’, ‘bar’)
.attr(‘x’, d => x(d.label))
.attr(‘y’, d => y(d.amount))
.attr(‘width’, x.bandwidth())
.attr(‘height’, d => height – y(d.amount))
.attr(‘rx’, BAR_RADIUS)
.attr(‘ry’, BAR_RADIUS)
.style(‘fill’, COLORS.BAR_COLOR)
.style(‘opacity’, COLORS.BAR_FILL_OPACITY);
chartGroup.selectAll(‘.bar-label’)
.data(data)
.enter().append(‘text’)
.attr(‘class’, ‘bar-label’)
.attr(‘x’, d => x(d.label) + x.bandwidth() / 2)
.attr(‘y’, d => y(d.amount) – 5)
.text(d => formatCompactWithB(d.amount))
.style(‘fill’, COLORS.TEXT_COLOR);
}
if (document.readyState === ‘loading’) {
document.addEventListener(‘DOMContentLoaded’, renderChart);
} else {
renderChart();
}
window.addEventListener(‘resize’, renderChart);
})();
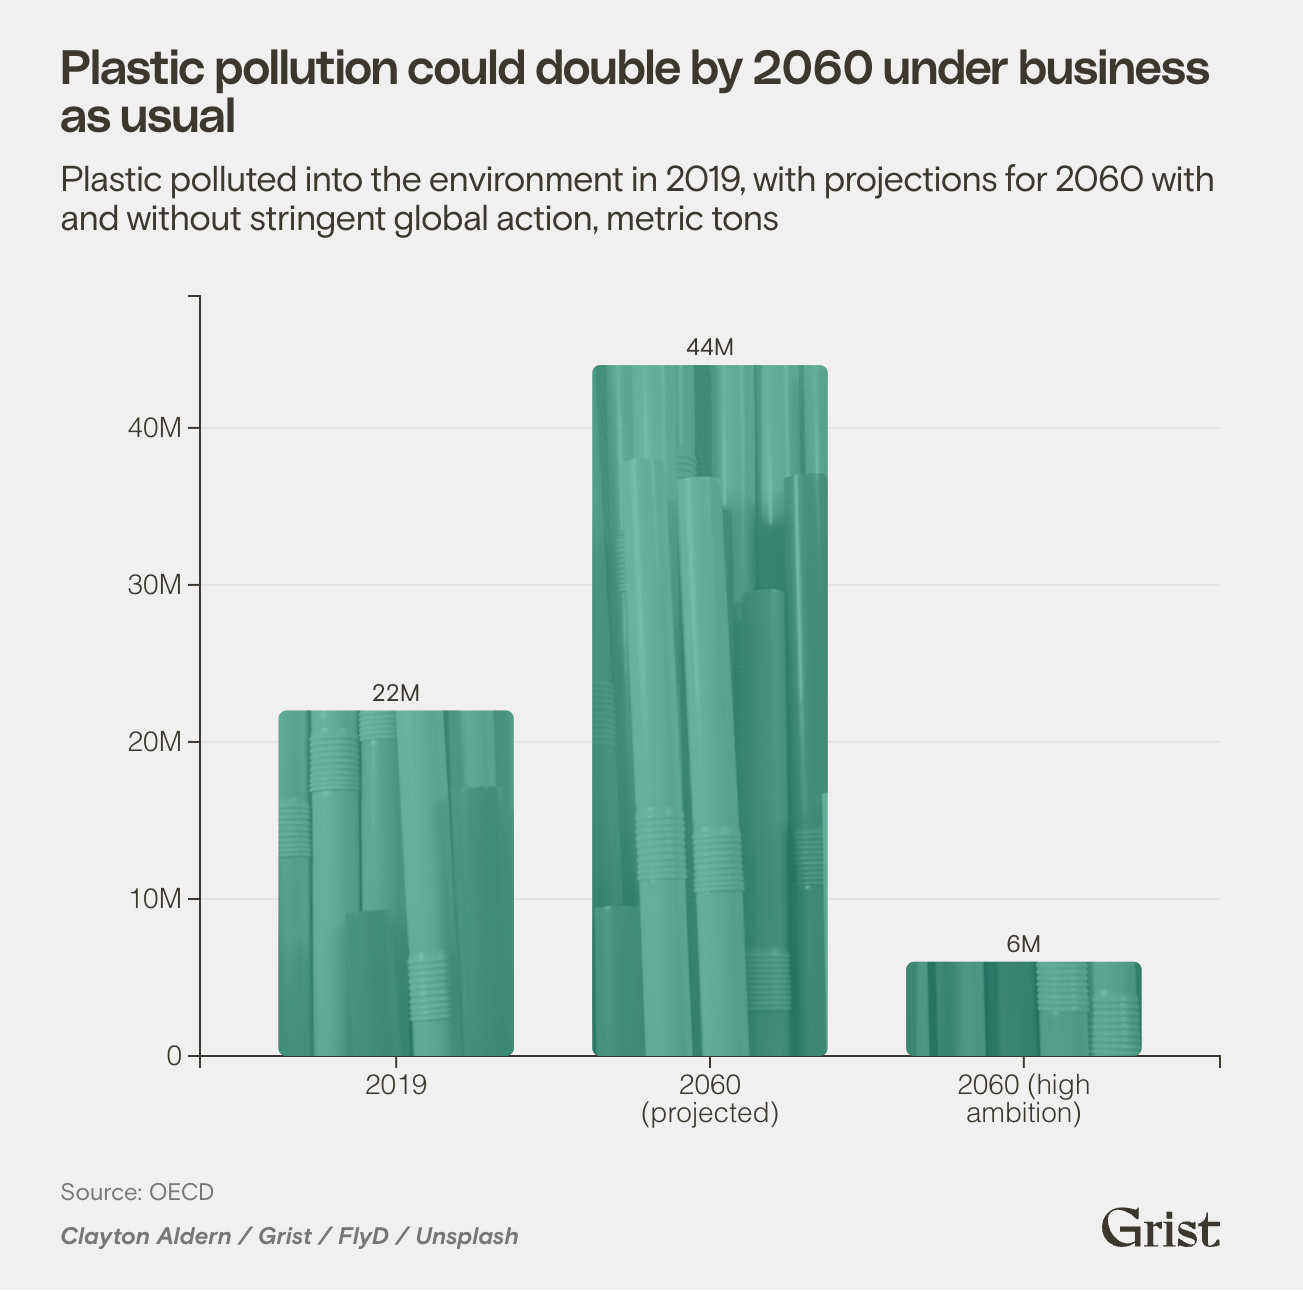
The OECD estimates that 22 million metric tons of plastic waste escaped into the environment in 2019. Under a business-as-usual scenario in which petrochemical companies continue ramping up plastic production, pollution is predicted to outstrip waste management and recycling even further, doubling to 44 million metric tons by 2060. Stringent global action could reduce this pollution to just 6 million metric tons by 2060, according to the OECD.
.plastic-chemicals {
–color-primary: #3c3830;
–color-secondary: #777;
–color-orange: #F79945;
–color-turquoise: #12A07F;
–color-fuchsia: #AC00E8;
–color-cobalt: #3977F3;
–color-earth: #3c3830;
–typography-primary: “PolySans”, Arial, sans-serif;
–typography-secondary: “Basis Grotesque”, Arial, sans-serif;
–spacing-base: 10px;
box-sizing: border-box;
font-family: var(–typography-secondary);
margin: 1.5rem auto;
padding: 0;
position: relative;
width: 100%;
}
.plastic-chemicals * { box-sizing: border-box; }
.plastic-chemicals__title { font-family: var(–typography-primary); font-size: 24px; margin: var(–spacing-base) 0; }
.plastic-chemicals__subtitle { font-family: var(–typography-secondary); color: var(–color-primary); font-size: 18px; margin: 0 0 var(–spacing-base); }
.pies-wrapper { display: flex; gap: 20px; align-items: flex-start; justify-content: space-between; flex-wrap: wrap; }
.pie-card { flex: 1 1 320px; min-width: 280px; max-width: 600px; }
.pie-title { font-family: var(–typography-primary); font-size: 16px; margin: 6px 0 10px 0; color: var(–color-primary); }
.legend { font-family: var(–typography-secondary); font-size: 12px; }
.legend-item { display: flex; align-items: center; margin: 5px 10px; }
.legend-color-box { width: 12px; height: 12px; display: inline-block; margin-right: 5px; vertical-align: middle; }
.label { font-family: var(–typography-secondary); font-size: 12px; fill: #fff; font-weight: bold; text-anchor: middle; }
.plastic-chemicals__footer { display: flex; justify-content: space-between; align-items: flex-end; margin-top: 8px; }
.plastic-chemicals__credits { display: flex; flex-direction: column; max-width: 60ch; }
.plastic-chemicals__source { color: var(–color-secondary); font-size: 12px; margin-top: 20px; position: relative; display: inline-block; }
.plastic-chemicals__credit { color: var(–color-secondary); font-size: 12px; margin-top: 3px; position: relative; font-style: italic; font-weight: bold; display: inline-block; }
.plastic-chemicals__logo { height: 20px; width: auto; margin-left: auto; padding-right: 20px; margin-right: 0; margin-bottom: 4px; }
@media (max-width: 650px) {
.plastic-chemicals__credits { max-width: 30ch; }
}
A quarter of known plastic chemicals have hazardous properties
Share of plastic chemicals known to have hazardous properties, and share that is subject to international regulations
(function() {
const INIT_KEY = ‘__grist_plastic_chemicals_initialized__’;
if (window[INIT_KEY]) { return; }
window[INIT_KEY] = true;
const COLORS = {
TEXT: ‘var(–color-primary)’,
PALETTE: [‘var(–color-fuchsia)’,’var(–color-cobalt)’,’var(–color-turquoise)’,’var(–color-orange)’,’var(–color-earth)’]
};
// Inline data from CSVs
const chemicalsData = [
{ type: ‘Chemicals of concern’, percent: 0.258 },
{ type: ‘No data’, percent: 0.657 },
{ type: ‘Less/not hazardous or evaluations under development’, percent: 0.085 }
];
const regulatedData = [
{ type: ‘Globally regulated’, percent: 0.06 },
{ type: ‘Not regulated’, percent: 0.94 }
];
function renderPie(svgSelector, legendSelector, data) {
const svg = d3.select(svgSelector);
const legend = d3.select(legendSelector);
svg.selectAll(‘*’).remove();
legend.selectAll(‘*’).remove();
const node = svg.node();
const styleWidth = parseInt(svg.style(‘width’));
const containerWidth = node ? node.getBoundingClientRect().width : (isNaN(styleWidth) ? 600 : styleWidth);
const height = 360;
const width = containerWidth;
const radius = Math.min(width, height) / 2 – 10;
svg.attr(‘height’, height);
const color = d3.scaleOrdinal().domain(data.map(d => d.type)).range(COLORS.PALETTE);
const pie = d3.pie().value(d => d.percent).sort(null);
const arc = d3.arc().innerRadius(0).outerRadius(radius);
const labelArc = d3.arc().innerRadius(radius * 0.6).outerRadius(radius * 0.6);
const g = svg.append(‘g’).attr(‘transform’, `translate(${width/2},${height/2})`);
// Image fills per slice via clipPaths
const defs = svg.append(‘defs’);
const imgPoolA = [
‘https://grist.org/wp-content/uploads/2025/08/sigmund-dBu3wq2O5SM-unsplash.jpg’,
‘https://grist.org/wp-content/uploads/2025/08/jon-moore-tIgJR__pjZw-unsplash.jpg’,
‘https://grist.org/wp-content/uploads/2025/08/sigmund-mFcsYcSSiMQ-unsplash.jpg’
];
const imgPoolB = [
‘https://grist.org/wp-content/uploads/2025/08/david-maier-JBM7b96RUQI-unsplash.jpg’,
‘https://grist.org/wp-content/uploads/2025/08/roberto-sorin-yf8j7Eqafco-unsplash.jpg’
];
const isFirstPie = svgSelector === ‘#pie-chemicals’;
const chosenPool = isFirstPie ? imgPoolA : imgPoolB;
// Greyscale filter so image fills are desaturated before color overlays
const greyFilterId = `${isFirstPie ? ‘chem’ : ‘reg’}Greyscale`;
const greyFilter = defs.append(‘filter’).attr(‘id’, greyFilterId);
greyFilter.append(‘feColorMatrix’).attr(‘type’, ‘saturate’).attr(‘values’, ‘0’);
const arcs = pie(data);
// Build per-slice patterns for image fills
arcs.forEach((d, i) => {
const patId = `${isFirstPie ? ‘chem’ : ‘reg’}Pat-${i}`;
const pat = defs.append(‘pattern’)
.attr(‘id’, patId)
.attr(‘patternUnits’, ‘userSpaceOnUse’)
.attr(‘width’, radius * 2)
.attr(‘height’, radius * 2)
.attr(‘x’, -radius)
.attr(‘y’, -radius);
pat.append(‘image’)
.attr(‘xlink:href’, chosenPool[i % chosenPool.length])
.attr(‘x’, 0)
.attr(‘y’, 0)
.attr(‘width’, radius * 2)
.attr(‘height’, radius * 2)
.attr(‘preserveAspectRatio’, ‘xMidYMid slice’)
.attr(‘filter’, `url(#${greyFilterId})`);
});
// Base image-filled slices
g.selectAll(‘.slice-img’)
.data(arcs)
.enter().append(‘path’)
.attr(‘class’, ‘slice-img’)
.attr(‘d’, arc)
.attr(‘fill’, (d, i) => `url(#${isFirstPie ? ‘chem’ : ‘reg’}Pat-${i})`)
.attr(‘transform’, null);
// Color overlay slices
g.selectAll(‘.slice-color’)
.data(arcs)
.enter().append(‘path’)
.attr(‘class’, ‘slice-color’)
.attr(‘d’, arc)
.attr(‘fill’, (d, i) => color(d.data.type))
.style(‘opacity’, 0.65);
g.selectAll(‘.label’)
.data(arcs)
.enter().append(‘text’)
.attr(‘class’, ‘label’)
.attr(‘transform’, d => `translate(${labelArc.centroid(d)})`)
.text(d => `${d3.format(‘.0%’)(d.data.percent)}`)
.each(function(d) {
const a = d.endAngle – d.startAngle;
if (a color(d.type));
legendItems.append(‘span’)
.attr(‘class’, ‘legend’)
.style(‘color’, COLORS.TEXT)
.text(d => `${d.type}`);
}
function renderAll() {
renderPie(‘#pie-chemicals’, ‘#legend-chemicals’, chemicalsData);
renderPie(‘#pie-regulated’, ‘#legend-regulated’, regulatedData);
}
if (document.readyState === ‘loading’) document.addEventListener(‘DOMContentLoaded’, renderAll); else renderAll();
window.addEventListener(‘resize’, renderAll);
})();
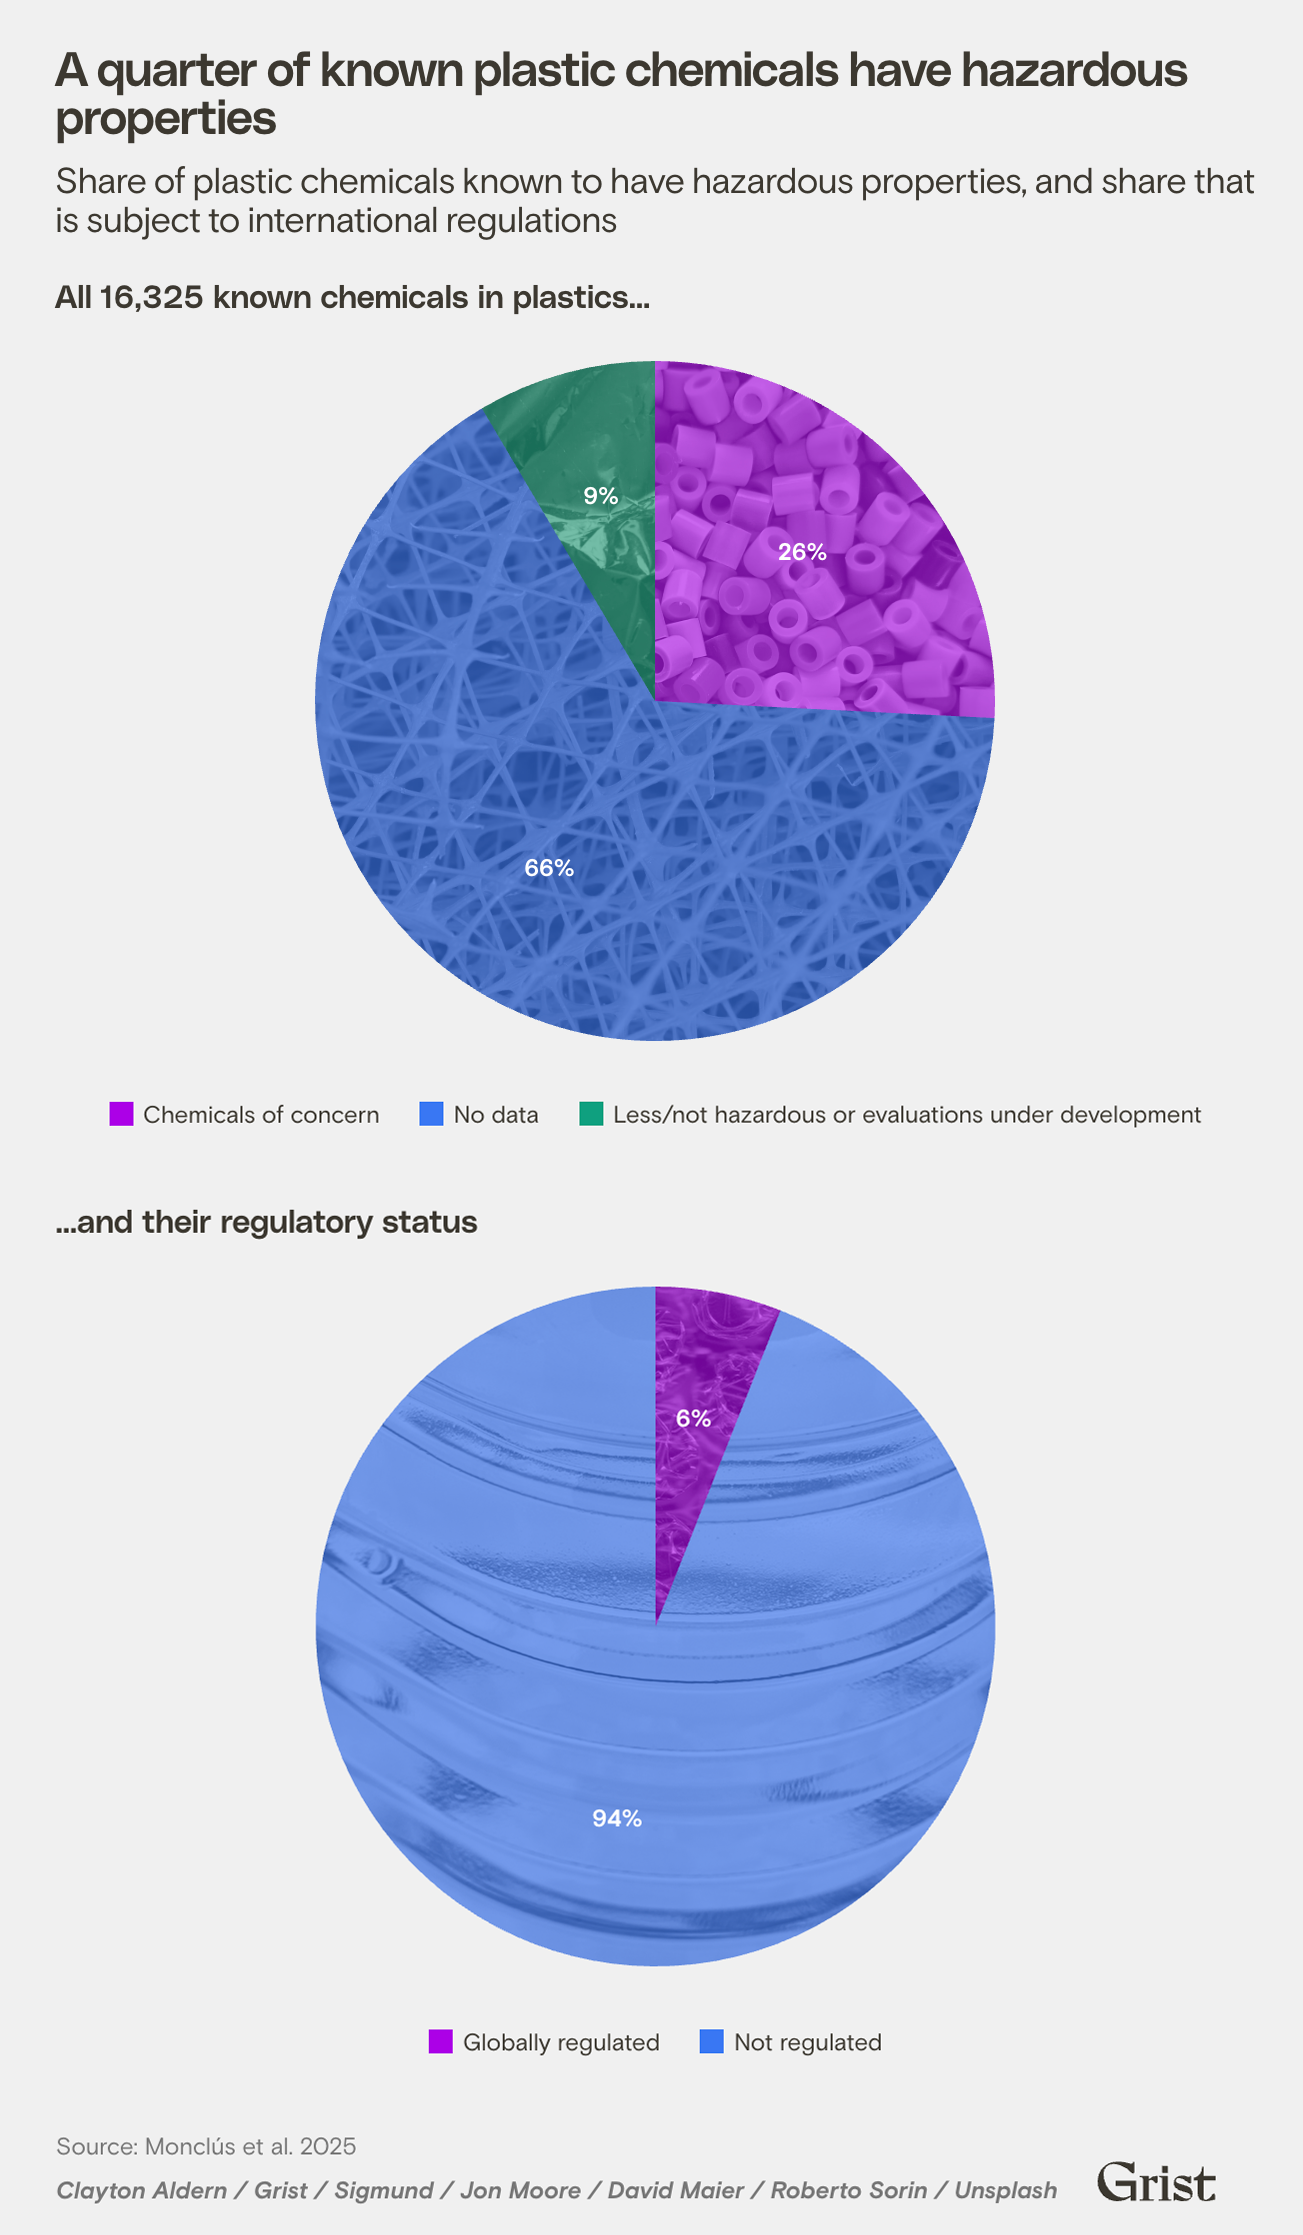
Plastics don’t only threaten the environment; they also threaten human health, in part because of their constitutive chemicals. A scientific paper published last month in the journal Nature identified 16,325 known plastic chemicals. Many are used as processing aids, or as additives that give plastic certain properties such as malleability. Of these chemicals, 4,219 — more than a quarter — are known to have hazardous properties in people or animals, such as carcinogenicity or the ability to bioaccumulate, making their way up the food chain as larger animals eater smaller ones. Most of the rest of the chemicals — 10,726, or 66 percent of the total — have never been assessed for toxicity.
Global health and environmental agreements such as the Stockholm Convention cover fewer than 1,000 plastics-related chemicals. That means that 15,345 — about 94 percent of the total — are not subject to international regulations. Researchers who are part of the Scientists’ Coalition for an Effective Plastics Treaty say this gap poses unacceptable human health risks that should be addressed by the U.N. agreement, ideally via legally binding lists of groups of chemicals that treaty signatories have to phase out.
.plastic-emissions {
–color-primary: #3c3830;
–color-secondary: #777;
–color-bar-fill: #AC00E8;
–typography-primary: “PolySans”, Arial, sans-serif;
–typography-secondary: “Basis Grotesque”, Arial, sans-serif;
–spacing-base: 10px;
box-sizing: border-box;
font-family: var(–typography-secondary);
margin: 1.5rem auto;
padding: 0;
position: relative;
width: 100%;
}
.plastic-emissions * { box-sizing: border-box; }
.plastic-emissions__title { font-family: var(–typography-primary); font-size: 24px; margin: var(–spacing-base) 0; text-align: left; }
.plastic-emissions__subtitle { font-family: var(–typography-secondary); color: var(–color-primary); font-size: 18px; margin: 0 0 var(–spacing-base); text-align: left; }
.plastic-emissions__axis-label { color: var(–color-primary); font-size: 14px; }
.plastic-emissions__footer { display: flex; justify-content: space-between; align-items: flex-end; margin-top: 0px; }
.plastic-emissions__credits { display: flex; flex-direction: column; }
.plastic-emissions__source { color: var(–color-secondary); font-size: 12px; left: var(–spacing-base); margin-top: 0; position: relative; display: inline-block; }
.plastic-emissions__credit { color: var(–color-secondary); font-size: 12px; left: var(–spacing-base); margin-top: 3px; position: relative; font-style: italic; font-weight: bold; display: inline-block; }
.plastic-emissions__logo { height: 20px; width: auto; margin-left: auto; padding-right: 20px; margin-right: 0; margin-bottom: 4px; align-self: flex-end; }
.bar-label { font-family: var(–typography-secondary); font-size: 12px; fill: var(–color-primary); text-anchor: middle; }
.axis-grid line { stroke: #e0e0e0; stroke-opacity: 0.7; shape-rendering: crispEdges; }
.axis-grid .domain { stroke: none; }
If the plastics industry were a country, it’d be the world’s fourth-biggest emitter
Plastics industry’s annual emissions compared to those of large countries, metric tons, 2019
(function() {
const INIT_KEY = ‘__grist_plastic_emissions_initialized__’;
if (window[INIT_KEY]) { return; }
window[INIT_KEY] = true;
const COLORS = { TEXT_COLOR: ‘var(–color-primary)’, BAR_FILL_OPACITY: 0.65, BAR_COLOR: ‘var(–color-bar-fill)’, HIGHLIGHT_COLOR: ‘#12A07F’ };
const svg = d3.select(‘#emissions-bar-chart’);
const initialSvgHeight = 450;
const BAR_RADIUS = 4;
const formatCompactWithB = (n) => d3.format(‘~s’)(n).replace(‘G’, ‘B’);
const rawData = [
{ name: ‘China’, amount: 10700000000 },
{ name: ‘United States’, amount: 5260000000 },
{ name: ‘India’, amount: 2610000000 },
{ name: ‘Plastic’, amount: 2240000000 },
{ name: ‘Russia’, amount: 1710000000 }
];
const data = rawData;
const margin = { top: 20, right: 20, bottom: 56, left: window.innerWidth width) {
line.pop();
tspan.text(line.join(‘ ‘));
line = [word];
tspan = text.append(‘tspan’).attr(‘x’, 0).attr(‘y’, y).attr(‘dy’, ++lineNumber * (lineHeight / 14) + dy + ’em’).text(word);
}
}
});
}
function renderChart() {
svg.selectAll(‘*’).remove();
const node = svg.node();
const styleWidth = parseInt(svg.style(‘width’));
const containerWidth = node ? node.getBoundingClientRect().width : (isNaN(styleWidth) ? 600 : styleWidth);
const width = containerWidth – margin.left – margin.right;
const height = initialSvgHeight – margin.top – margin.bottom;
svg.attr(‘height’, initialSvgHeight);
const x = d3.scaleBand().domain(data.map(d => d.name)).range([0, width]).padding(0.25);
const y = d3.scaleLinear().domain([0, d3.max(data, d => d.amount) * 1.1]).range([height, 0]);
svg.append(‘g’)
.attr(‘class’, ‘axis-grid’)
.attr(‘transform’, `translate(${margin.left},${margin.top})`)
.call(d3.axisLeft(y).ticks(5).tickSize(-width).tickFormat(”));
const xAxis = g => {
g.attr(‘transform’, `translate(${margin.left},${height + margin.top})`)
.call(d3.axisBottom(x));
const maxWidth = Math.min(80, Math.max(48, width / data.length – 6));
g.selectAll(‘.tick text’)
.attr(‘class’, ‘plastic-emissions__axis-label’)
.style(‘fill’, COLORS.TEXT_COLOR)
.style(‘text-anchor’, ‘middle’)
.call(wrapSvgText, maxWidth, 14);
};
const yAxis = g => g
.attr(‘transform’, `translate(${margin.left},${margin.top})`)
.call(d3.axisLeft(y).ticks(5).tickFormat(d => formatCompactWithB(d)))
.selectAll(‘text’)
.attr(‘class’, ‘plastic-emissions__axis-label’)
.style(‘fill’, COLORS.TEXT_COLOR);
svg.append(‘g’).call(xAxis);
svg.append(‘g’).call(yAxis);
const chartGroup = svg.append(‘g’).attr(‘transform’, `translate(${margin.left},${margin.top})`);
// Image fill across all bars using a mask
const defs = chartGroup.append(‘defs’);
const grayFilter = defs.append(‘filter’).attr(‘id’, ’emissionsGreyscale’);
grayFilter.append(‘feColorMatrix’).attr(‘type’, ‘saturate’).attr(‘values’, ‘0’);
const barsMask = defs.append(‘mask’).attr(‘id’, ’emissionsBarsMask’);
data.forEach(d => {
barsMask.append(‘rect’)
.attr(‘x’, x(d.name))
.attr(‘y’, y(d.amount))
.attr(‘width’, x.bandwidth())
.attr(‘height’, height – y(d.amount))
.attr(‘rx’, BAR_RADIUS)
.attr(‘ry’, BAR_RADIUS)
.attr(‘fill’, ‘white’);
});
chartGroup.append(‘image’)
.attr(‘xlink:href’, ‘https://grist.org/wp-content/uploads/2025/08/jonathan-chng-OTDyDgPoJ_0-unsplash.jpg’)
.attr(‘x’, 0)
.attr(‘y’, 0)
.attr(‘width’, width)
.attr(‘height’, height)
.attr(‘preserveAspectRatio’, ‘xMidYMid slice’)
.attr(‘mask’, ‘url(#emissionsBarsMask)’)
.attr(‘filter’, ‘url(#emissionsGreyscale)’);
chartGroup.selectAll(‘.bar’)
.data(data)
.enter().append(‘rect’)
.attr(‘class’, ‘bar’)
.attr(‘x’, d => x(d.name))
.attr(‘y’, d => y(d.amount))
.attr(‘width’, x.bandwidth())
.attr(‘height’, d => height – y(d.amount))
.attr(‘rx’, BAR_RADIUS)
.attr(‘ry’, BAR_RADIUS)
.style(‘fill’, d => d.name === ‘Plastic’ ? COLORS.HIGHLIGHT_COLOR : COLORS.BAR_COLOR)
.style(‘opacity’, COLORS.BAR_FILL_OPACITY);
chartGroup.selectAll(‘.bar-label’)
.data(data)
.enter().append(‘text’)
.attr(‘class’, ‘bar-label’)
.attr(‘x’, d => x(d.name) + x.bandwidth() / 2)
.attr(‘y’, d => y(d.amount) – 5)
.text(d => formatCompactWithB(d.amount))
.style(‘fill’, COLORS.TEXT_COLOR);
}
if (document.readyState === ‘loading’) { document.addEventListener(‘DOMContentLoaded’, renderChart); } else { renderChart(); }
window.addEventListener(‘resize’, renderChart);
})();
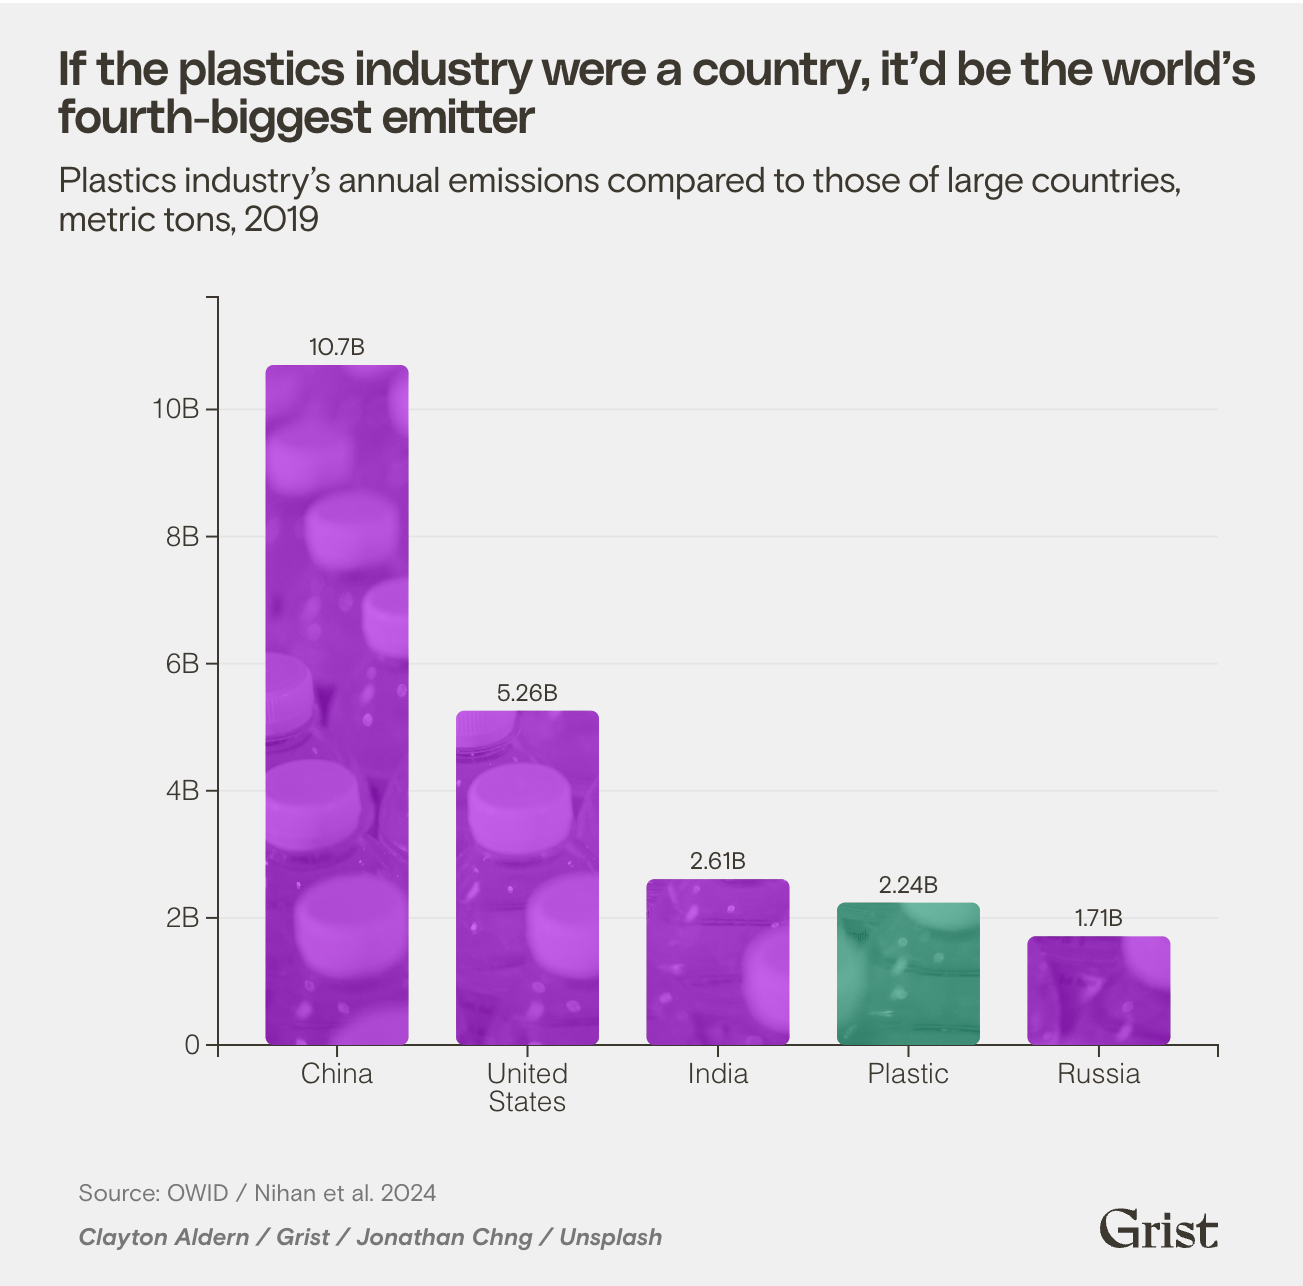
In addition to being a public health and environmental scourge, plastics are also increasingly being recognized as a climate change issue. They’re made from fossil fuels, after all. According to a study published last year by the Lawrence Livermore National Laboratory, plastics were responsible for roughly 5 percent of global greenhouse gas emissions in 2019. That year, the industry’s emissions were nearly equivalent to those of India.
More recent research from the Plastics & Climate Project has identified significant data gaps on plastics’ climate footprint. In a systematic review published in April, they called for a deeper look at the release of greenhouse gases from existing plastic pollution, the effects of plastic pollution on the amount of heat the Earth traps, and the potential for microplastics to inhibit the natural processes that sequester carbon on the ocean floor.
.plastic-waste-chart-container{
max-width: 1050px;
margin: 30px auto;
box-sizing: border-box;
position: relative;
}
.plastic-waste-chart {
/* Theme variables to match other plastic charts */
–color-primary: #3c3830;
–color-secondary: #777;
–color-fuchsia: #AC00E8;
–color-grid: #e0e0e0;
–typography-primary: ‘PolySans’, Arial, sans-serif;
–typography-secondary: ‘Basis Grotesque’, Arial, sans-serif;
font-family: var(–typography-secondary);
color: var(–color-primary);
}
.plastic-waste-chart .chart-container {
width: 100%;
margin: 20px auto;
position: relative;
}
.plastic-waste-chart h1 {
font-family: var(–typography-primary);
font-size: 24px;
margin: 10px 0;
}
.plastic-waste-chart h2 {
font-family: var(–typography-secondary);
font-size: 18px;
font-weight: normal;
margin: 0 0 10px 0;
color: var(–color-primary);
}
.plastic-waste-chart .legend {
display: flex;
justify-content: flex-start;
align-items: center;
flex-wrap: wrap;
margin-bottom: 20px;
}
.plastic-waste-chart .legend-item {
display: flex;
font-size: 12px;
align-items: center;
margin: 0 20px 0 0;
}
.plastic-waste-chart .legend-color {
width: 20px;
height: 3px;
margin-right: 5px;
}
.plastic-waste-chart .radio-buttons {
display: flex;
flex-wrap: nowrap;
justify-content: space-between;
margin-top: 10px;
gap: 10px;
}
.plastic-waste-chart .radio-buttons label {
font-size: 12px;
display: flex;
align-items: flex-start;
text-align: left;
margin: 0;
flex: 1;
min-width: 0;
}
.plastic-waste-chart input[type=”radio”] {
margin-right: 5px;
flex-shrink: 0;
}
.plastic-waste-chart .radio-buttons label span {
white-space: normal;
}
.plastic-waste-chart .axis text {
font-size: 14px;
fill: var(–color-primary);
}
.plastic-waste-chart .axis line,
.plastic-waste-chart .axis path {
stroke: var(–color-primary);
stroke-width: 1;
}
.plastic-waste-chart .grid line {
stroke: var(–color-grid);
stroke-opacity: 0.7;
shape-rendering: crispEdges;
}
.plastic-waste-chart .grid {
display: block !important;
}
.plastic-waste-chart .grid path {
stroke-width: 0;
}
.plastic-waste-chart .caption-container {
display: flex;
justify-content: space-between;
align-items: flex-end;
margin-top: 10px;
}
.plastic-waste-chart .caption {
font-size: 12px;
text-align: left;
line-height: 1.2;
margin-bottom: 0;
color: var(–color-secondary);
}
.plastic-waste-chart .caption em {
display: block;
font-style: italic;
font-weight: bold;
}
.plastic-waste-chart .logo {
height: 20px;
width: auto;
margin-left: auto;
margin-right: 0;
padding-right: 20px;
align-self: flex-end;
}
.plastic-waste-chart .tooltip {
position: absolute;
padding: 10px;
background: rgba(255, 255, 255, 0.9);
border: 2px solid #888;
pointer-events: none;
font-size: 12px;
white-space: nowrap;
z-index: 1000;
opacity: 0;
transition: opacity 0.3s;
}
.plastic-waste-chart .tooltip .key {
color: var(–color-primary);
font-weight: normal;
}
.plastic-waste-chart .tooltip .value {
font-weight: bold;
}
@media (max-width: 600px){
.plastic-waste-chart-container {
width: calc(100vw – 40px);
}
.plastic-waste-chart .radio-buttons {
flex-wrap: wrap;
}
.plastic-waste-chart .radio-buttons label {
flex-basis: 100%;
}
}
Research has found that a production cap is the most effective policy
Global annual rate of mismanaged waste, million metric tons
Business as usual
Selected scenario
Grist / Clayton Aldern
const scenarios = {
businessAsUsual: [
{ year: 2011, value: 50.46496953 },
{ year: 2012, value: 50.20890935 },
{ year: 2013, value: 50.74394429 },
{ year: 2014, value: 51.83005182 },
{ year: 2015, value: 58.11035793 },
{ year: 2016, value: 59.10216039 },
{ year: 2017, value: 58.59658602 },
{ year: 2018, value: 57.88913604 },
{ year: 2019, value: 60.02934696 },
{ year: 2020, value: 62.26595108 },
{ year: 2021, value: 68.04017001 },
{ year: 2022, value: 69.01498541 },
{ year: 2023, value: 71.86073872 },
{ year: 2024, value: 73.46147385 },
{ year: 2025, value: 74.88266943 },
{ year: 2026, value: 77.58385099 },
{ year: 2027, value: 79.84059725 },
{ year: 2028, value: 82.4876294 },
{ year: 2029, value: 84.46743645 },
{ year: 2030, value: 86.1896543 },
{ year: 2031, value: 88.7294423 },
{ year: 2032, value: 90.96654354 },
{ year: 2033, value: 93.11882011 },
{ year: 2034, value: 94.84288626 },
{ year: 2035, value: 96.77248669 },
{ year: 2036, value: 99.56012529 },
{ year: 2037, value: 101.6954891 },
{ year: 2038, value: 104.9985582 },
{ year: 2039, value: 106.8202805 },
{ year: 2040, value: 108.202317 },
{ year: 2041, value: 109.6350058 },
{ year: 2042, value: 111.0728593 },
{ year: 2043, value: 112.3961641 },
{ year: 2044, value: 113.916058 },
{ year: 2045, value: 115.4012671 },
{ year: 2046, value: 117.1737153 },
{ year: 2047, value: 118.263984 },
{ year: 2048, value: 118.8619764 },
{ year: 2049, value: 119.49624 },
{ year: 2050, value: 120.9280966 }
],
scenario1: [
{ year: 2011, value: 50.46496953 },
{ year: 2012, value: 50.20890935 },
{ year: 2013, value: 50.74394429 },
{ year: 2014, value: 51.83005182 },
{ year: 2015, value: 58.11035793 },
{ year: 2016, value: 59.10216039 },
{ year: 2017, value: 58.59658602 },
{ year: 2018, value: 57.88913604 },
{ year: 2019, value: 60.02934696 },
{ year: 2020, value: 62.26595108 },
{ year: 2021, value: 68.04017 },
{ year: 2022, value: 69.01498541 },
{ year: 2023, value: 71.86073872 },
{ year: 2024, value: 73.46147385 },
{ year: 2025, value: 74.88266943 },
{ year: 2026, value: 75.65433794 },
{ year: 2027, value: 75.94961524 },
{ year: 2028, value: 76.58648592 },
{ year: 2029, value: 76.51056447 },
{ year: 2030, value: 76.1470229 },
{ year: 2031, value: 76.53307034 },
{ year: 2032, value: 76.55281299 },
{ year: 2033, value: 76.42869502 },
{ year: 2034, value: 75.77349141 },
{ year: 2035, value: 74.31532406 },
{ year: 2036, value: 73.46992062 },
{ year: 2037, value: 71.8233385 },
{ year: 2038, value: 71.00730144 },
{ year: 2039, value: 68.64477513 },
{ year: 2040, value: 66.39511673 },
{ year: 2041, value: 67.2985692 },
{ year: 2042, value: 68.73540164 },
{ year: 2043, value: 69.9888915 },
{ year: 2044, value: 71.29991683 },
{ year: 2045, value: 72.68661562 },
{ year: 2046, value: 74.41837755 },
{ year: 2047, value: 75.47436363 },
{ year: 2048, value: 75.948207 },
{ year: 2049, value: 76.6358516 },
{ year: 2050, value: 78.1558592 }
],
scenario2: [
{ year: 2011, value: 50.46496953 },
{ year: 2012, value: 50.20890935 },
{ year: 2013, value: 50.74394429 },
{ year: 2014, value: 51.83005182 },
{ year: 2015, value: 58.11035793 },
{ year: 2016, value: 59.10216039 },
{ year: 2017, value: 58.59658602 },
{ year: 2018, value: 57.88913604 },
{ year: 2019, value: 60.02934696 },
{ year: 2020, value: 62.26595108 },
{ year: 2021, value: 68.04017 },
{ year: 2022, value: 69.01498541 },
{ year: 2023, value: 71.86073872 },
{ year: 2024, value: 73.46147385 },
{ year: 2025, value: 74.88266943 },
{ year: 2026, value: 76.74279839 },
{ year: 2027, value: 77.95857272 },
{ year: 2028, value: 79.3022106 },
{ year: 2029, value: 79.83909563 },
{ year: 2030, value: 80.04308937 },
{ year: 2031, value: 80.89390493 },
{ year: 2032, value: 81.21461614 },
{ year: 2033, value: 81.5180018 },
{ year: 2034, value: 81.32031593 },
{ year: 2035, value: 81.3884557 },
{ year: 2036, value: 81.6368248 },
{ year: 2037, value: 80.66137215 },
{ year: 2038, value: 80.65020294 },
{ year: 2039, value: 79.0789492 },
{ year: 2040, value: 77.17195462 },
{ year: 2041, value: 76.81543309 },
{ year: 2042, value: 76.72018718 },
{ year: 2043, value: 76.26981301 },
{ year: 2044, value: 75.69036433 },
{ year: 2045, value: 75.31375843 },
{ year: 2046, value: 75.6665513 },
{ year: 2047, value: 75.04354515 },
{ year: 2048, value: 73.54936554 },
{ year: 2049, value: 72.68410512 },
{ year: 2050, value: 72.87525235 }
],
scenario3: [
{ “year”: 2011, “value”: 50.46496953 },
{ “year”: 2012, “value”: 50.20890935 },
{ “year”: 2013, “value”: 50.74394429 },
{ “year”: 2014, “value”: 51.83005182 },
{ “year”: 2015, “value”: 58.11035793 },
{ “year”: 2016, “value”: 59.10216039 },
{ “year”: 2017, “value”: 58.59658602 },
{ “year”: 2018, “value”: 57.88913604 },
{ “year”: 2019, “value”: 60.02934696 },
{ “year”: 2020, “value”: 62.26595108 },
{ “year”: 2021, “value”: 68.04017001 },
{ “year”: 2022, “value”: 69.01498541 },
{ “year”: 2023, “value”: 71.86073872 },
{ “year”: 2024, “value”: 73.46147385 },
{ “year”: 2025, “value”: 74.88266943 },
{ “year”: 2026, “value”: 74.81355413 },
{ “year”: 2027, “value”: 74.07105346 },
{ “year”: 2028, “value”: 73.4157434 },
{ “year”: 2029, “value”: 71.92180959 },
{ “year”: 2030, “value”: 70.08402753 },
{ “year”: 2031, “value”: 68.86784854 },
{ “year”: 2032, “value”: 67.11459961 },
{ “year”: 2033, “value”: 65.33600413 },
{ “year”: 2034, “value”: 63.08596602 },
{ “year”: 2035, “value”: 61.08422456 },
{ “year”: 2036, “value”: 59.23760316 },
{ “year”: 2037, “value”: 56.26325422 },
{ “year”: 2038, “value”: 54.21107557 },
{ “year”: 2039, “value”: 50.77832829 },
{ “year”: 2040, “value”: 47.11210399 },
{ “year”: 2041, “value”: 46.49868066 },
{ “year”: 2042, “value”: 46.4288313 },
{ “year”: 2043, “value”: 46.02618694 },
{ “year”: 2044, “value”: 45.49025353 },
{ “year”: 2045, “value”: 45.1085154 },
{ “year”: 2046, “value”: 45.41997652 },
{ “year”: 2047, “value”: 44.89392646 },
{ “year”: 2048, “value”: 43.61441905 },
{ “year”: 2049, “value”: 42.85651875 },
{ “year”: 2050, “value”: 43.08215983 }
]
};
const scenarioLabels = {
scenario1: “Recycling policies and funding, no production cap”,
scenario2: “Production cap at 2019 levels alone”,
scenario3: “Recycling policies and funding, production cap at 2019 levels”
};
function createChart() {
d3.select(“#chart”).selectAll(“*”).remove();
const containerWidth = document.querySelector(‘.chart-container’).clientWidth;
const margin = { top: 20, right: 20, bottom: 60, left: 40 };
const width = containerWidth – margin.left – margin.right;
const height = Math.min(333, window.innerHeight * 0.47) – margin.top – margin.bottom;
const svg = d3.select(“#chart”)
.append(“svg”)
.attr(“viewBox”, `0 0 ${width + margin.left + margin.right} ${height + margin.top + margin.bottom}`)
.append(“g”)
.attr(“transform”, `translate(${margin.left},${margin.top})`);
const x = d3.scaleLinear()
.domain(d3.extent(scenarios.businessAsUsual, d => d.year))
.range([0, width]);
const y = d3.scaleLinear()
.domain([0, d3.max(Object.values(scenarios).flat(), d => d.value)])
.range([height, 0]);
const line = d3.line()
.x(d => x(d.year))
.y(d => y(d.value));
svg.append(“g”)
.attr(“class”, “grid”)
.call(d3.axisLeft(y)
.tickSize(-width)
.tickFormat(“”)
)
.call(g => g.select(“.domain”).remove());
svg.append(“g”)
.attr(“class”, “axis”)
.attr(“transform”, `translate(0,${height})`)
.call(d3.axisBottom(x).ticks(width d.year).left;
svg.on(“mouseover mousemove”, function(event) {
const [mouseX] = d3.pointer(event, this);
const x0 = x.invert(mouseX);
const indexBAU = bisect(scenarios.businessAsUsual, x0);
const indexScenario = bisect(scenarios[scenario], x0);
const dataBAU = scenarios.businessAsUsual[indexBAU];
const dataScenario = scenarios[scenario][indexScenario];
let tooltipContent = `
Year: ${dataBAU.year}
Business as usual: ${dataBAU.value.toFixed(1)} Mt
${scenarioLabels[scenario]}: ${dataScenario.value.toFixed(1)} Mt
`;
const chartContainer = document.querySelector(‘.chart-container’);
const chartRect = chartContainer.getBoundingClientRect();
const tooltipX = event.clientX – chartRect.left + 10;
const tooltipY = event.clientY – chartRect.top – 28;
tooltip.html(tooltipContent)
.style(“left”, `${tooltipX}px`)
.style(“top”, `${tooltipY}px`)
.style(“opacity”, 1)
.style(“display”, “block”);
});
svg.on(“mouseout”, function() {
tooltip.style(“opacity”, 0)
.style(“display”, “none”);
});
}
// Initial chart render
updateChart(‘scenario1’);
// Event listeners for radio buttons
document.querySelectorAll(‘.plastic-waste-chart input[name=”scenario”]’).forEach(radio => {
radio.addEventListener(‘change’, (e) => {
updateChart(e.target.value);
});
});
}
// Create chart initially and on window resize
createChart();
window.addEventListener(‘resize’, createChart);
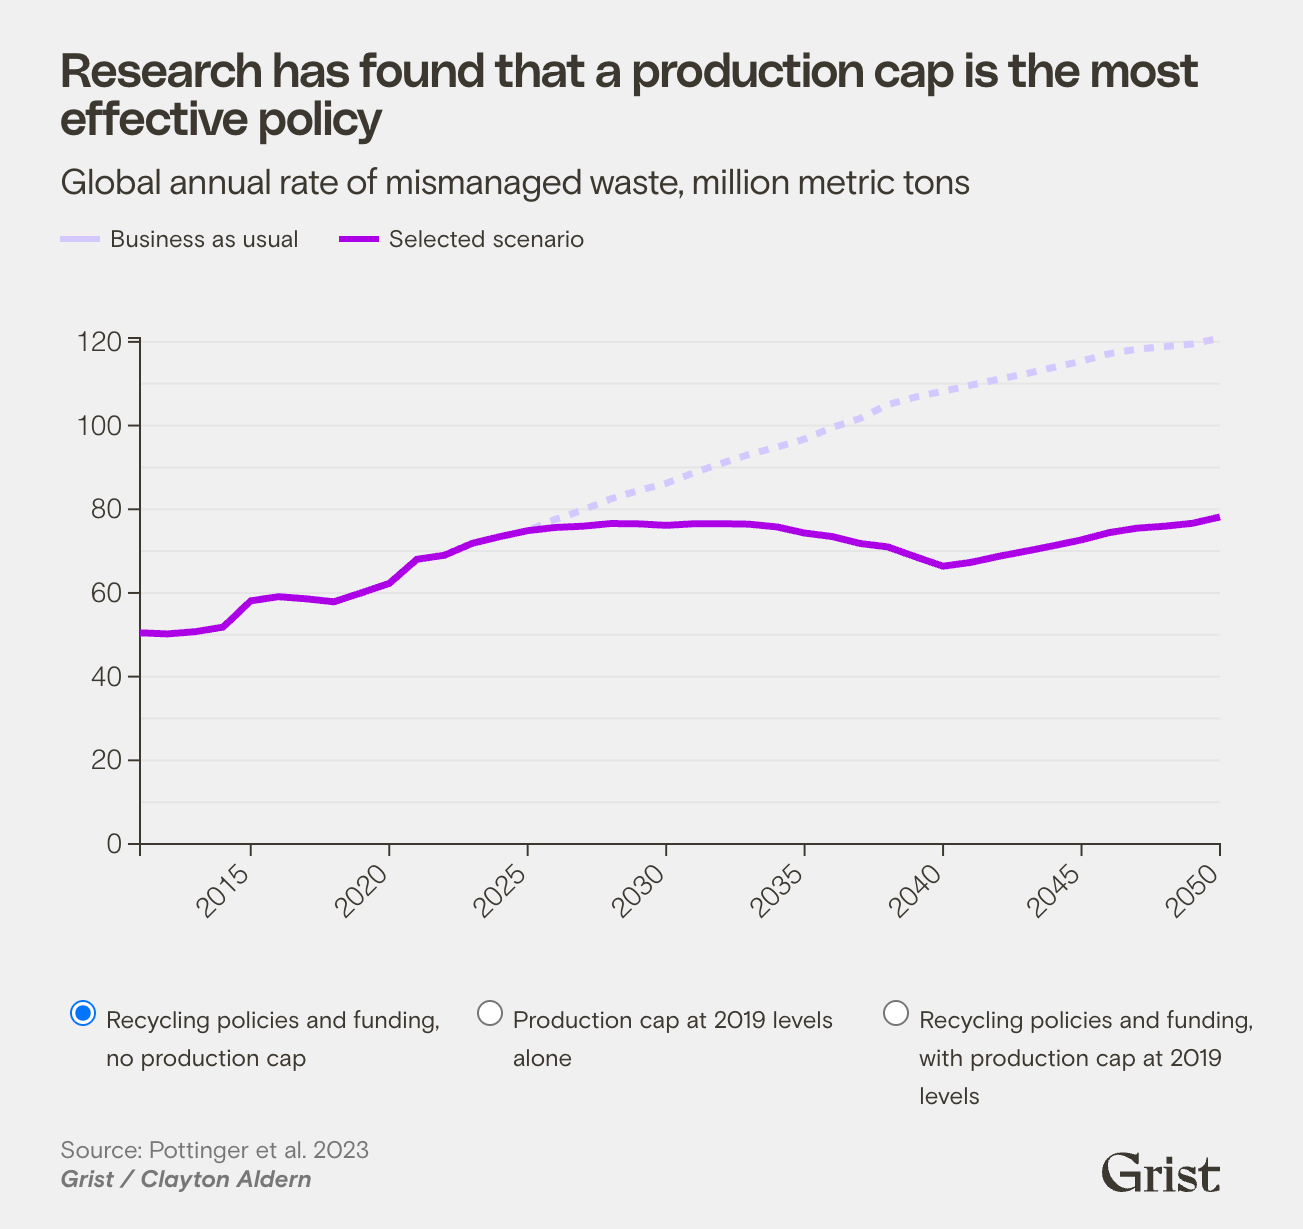
Decisions made during the plastic treaty negotiations will determine the future of plastic pollution. The single most effective intervention, according to modeling from a team of scientists at the University of California, Berkeley, and the University of California, Santa Barbara, is a global production cap. But other, less controversial policies — such as more recycling infrastructure and funding for waste management — would help, too. An ambitious scenario combining a production cap and those recycling policies and funding could prevent nearly 78 million metric tons of annual plastic pollution by 2050.
Correction: This story originally misstated the number of charts contained therein.
toolTips(‘.classtoolTips3′,’Carbon dioxide, methane, nitrous oxide, and other gases that prevent heat from escaping Earth’s atmosphere. Together, they act as a blanket to keep the planet at a liveable temperature in what is known as the “greenhouse effect.” Too many of these gases, however, can cause excessive warming, disrupting fragile climates and ecosystems.’); toolTips(‘.classtoolTips10′,’A scarce blue metal that helps battery cathodes store large amounts of energy without overheating or collapsing. It is a key component of lithium-ion batteries. ‘);
This story was originally published by Grist with the headline The global plastics crisis explained in 6 charts on Aug 8, 2025.


