The $127 Trillion Global Stock Market in One Giant Chart
Key Takeaways
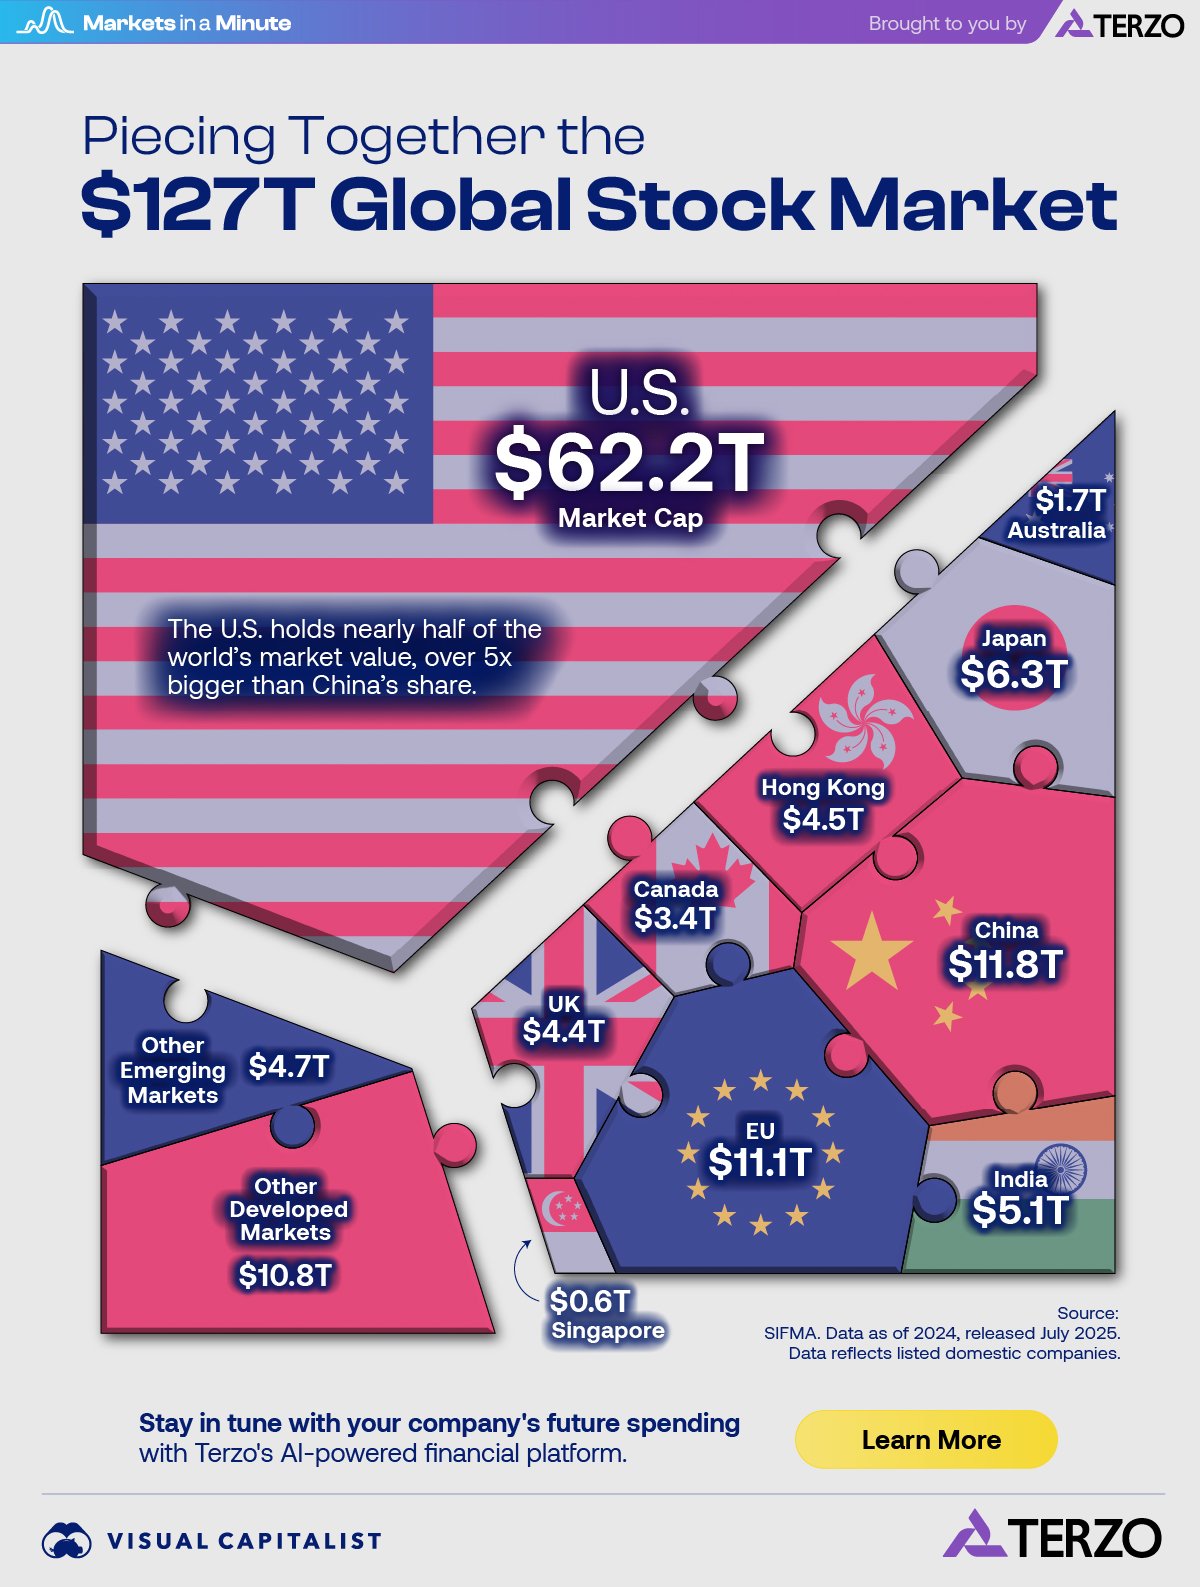
- The global stock market has a total value of $127 trillion.
- Nearly half of that value is in America, with a total of $62.2 trillion.
- China and the EU have the next largest values of $11.8 trillion and $11.1 trillion, respectively.
From Wall Street to Shanghai, stock markets form the backbone of modern economies. But where exactly is the bulk of the global stock market concentrated?
This Markets in a Minute graphic, in partnership with Terzo, breaks down the staggering $127 trillion global equity value.
The Global Stock Market: A Geographic View
Using data from SIFMA, let’s take a look at how global stock market value is distributed across key economies and regions. The data reflects listed domestic companies and excludes private equity.
| Market | Market Cap | % of Total |
|---|---|---|
| U.S. | $62.2T | 49.1% |
| China | $11.8T | 9.3% |
| EU | $11.1T | 8.7% |
| Japan | $6.3T | 5.0% |
| India | $5.1T | 4.1% |
| Hong Kong | $4.5T | 3.6% |
| UK | $4.4T | 3.5% |
| Canada | $3.4T | 2.7% |
| Australia | $1.7T | 1.4% |
| Singapore | $0.6T | 0.5% |
| Other Developed Markets | $10.8T | 8.5% |
| Other Emerging Markets | $4.7T | 3.7% |
Data as of 2024, released July 2025.
The U.S. stock market is by far the largest, making up nearly half of equity value. Its share of the global market went up 7% from 2023 to 2024, the biggest jump of any country or region.
Historically, the U.S. share of the global stock market has fluctuated. In the early 1970s it climbed to around 70%, dipping in the 1980s partly due to the Japanese asset price bubble. After that, America’s proportion climbed again until the 2009 global financial crisis caused it to bottom out. Over the last 15 years, the U.S. equity share has grown from 30% to 49%.
Other Key Equity Markets
China is the second-largest stock market, though it is over five times smaller than the U.S. market. The country’s equity share is smaller than its proportion of the world economy in GDP terms. Foreign ownership restrictions and state-owned enterprises reduce the number of companies that are freely traded on public markets.
Following closely behind China, the EU has a collective share of nearly 9%. However, while China’s share remained stable, the EU saw a 2% decline in its global share from 2023 to 2024. The region faced political turmoil, low economic growth projections, and equity outflows.
Armed with this information on the stock market, investors can diversify and set geographic allocations in their portfolio.

Get a holistic view of your company’s spending with Terzo’s AI-powered financial platform.
-

 Personal Finance1 week ago
Late to the Ladder: The Rise in First-Time Home Buyers’ Age
The median age of first-time home buyers has reached a historic high. See just how long it’s taking people to get on the property ladder.
-

 Markets3 weeks ago
Unpacking Real Estate Ownership by Generation (1991 vs. 2025)
The Silent Generation’s share of real estate has dropped dramatically as people age, but how have Baby Boomers, Gen X, and Millennials fared?
-

 Business4 weeks ago
America’s Economic Engines: The Biggest Industry in Every State
Real estate is the biggest industry by GDP in 26 states. Find out why it dominates—and what fuels the rest of the country.
-

 Maps1 month ago
Mapped: Manufacturing as a Share of GDP, by U.S. State
Tariffs are rising to boost American-made goods. Which states gain the most—and least—from manufacturing today?
-

 Technology2 months ago
Profit Powerhouses: Ranking The Top 10 U.S. Companies by Net Income
Collectively, the ten most profitable U.S. companies have a net income of $684 billion—more than the entire GDP of Belgium.
-

 Money2 months ago
Millionaire Hubs: Mapping the World’s Wealthiest Cities
New York City has the highest millionaire population globally. Which other cities attract the world’s wealthiest?
-
 Economy2 months ago
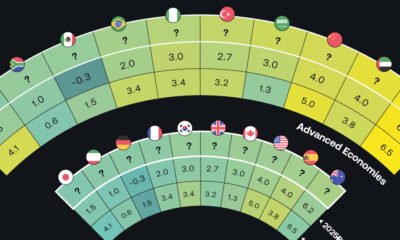
Tomorrow’s Growth: GDP Projections in Key Economies
The global economy is expected to have slighter slower growth going forward. Which countries are on track to have the biggest GDP increases?
-

 Money4 months ago
Mapped: Interest Rates by Country in 2025
The U.S. has kept their target rate the same at 4.25-4.50%. What do interest rates look like in other countries amid economic uncertainty?
-

 Markets5 months ago
U.S. Housing Prices: Which States Are Booming or Cooling?
The national housing market saw a 4.5% rise in house prices. This graphic reveals which states had high price growth, and which didn’t.
-

 Investor Education5 months ago
The Silent Thief: How Inflation Erodes Investment Gains
If you held a $1,000 investment from 1975-2024, this chart shows how the inflation rate can drastically reduce the value of your money.
-

 Politics6 months ago
Trade Tug of War: America’s Largest Trade Deficits
Trump cites trade deficits—the U.S. importing more than it exports—as one reason for tariffs. Which countries represent the largest deficits?
- Source: https://www.visualcapitalist.com/sp/ter01-piecing-together-the-127-trillion-global-stock-market/