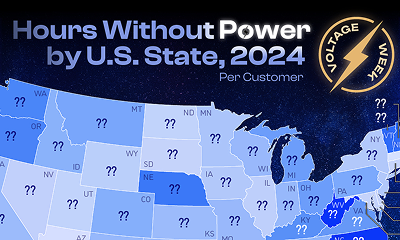
Blackout Map: Which States Lost the Most Power in 2024?
As America’s aging power grid continues to deteriorate, the risk of disruptions and blackouts is rising. But are these problems spread evenly across the country?
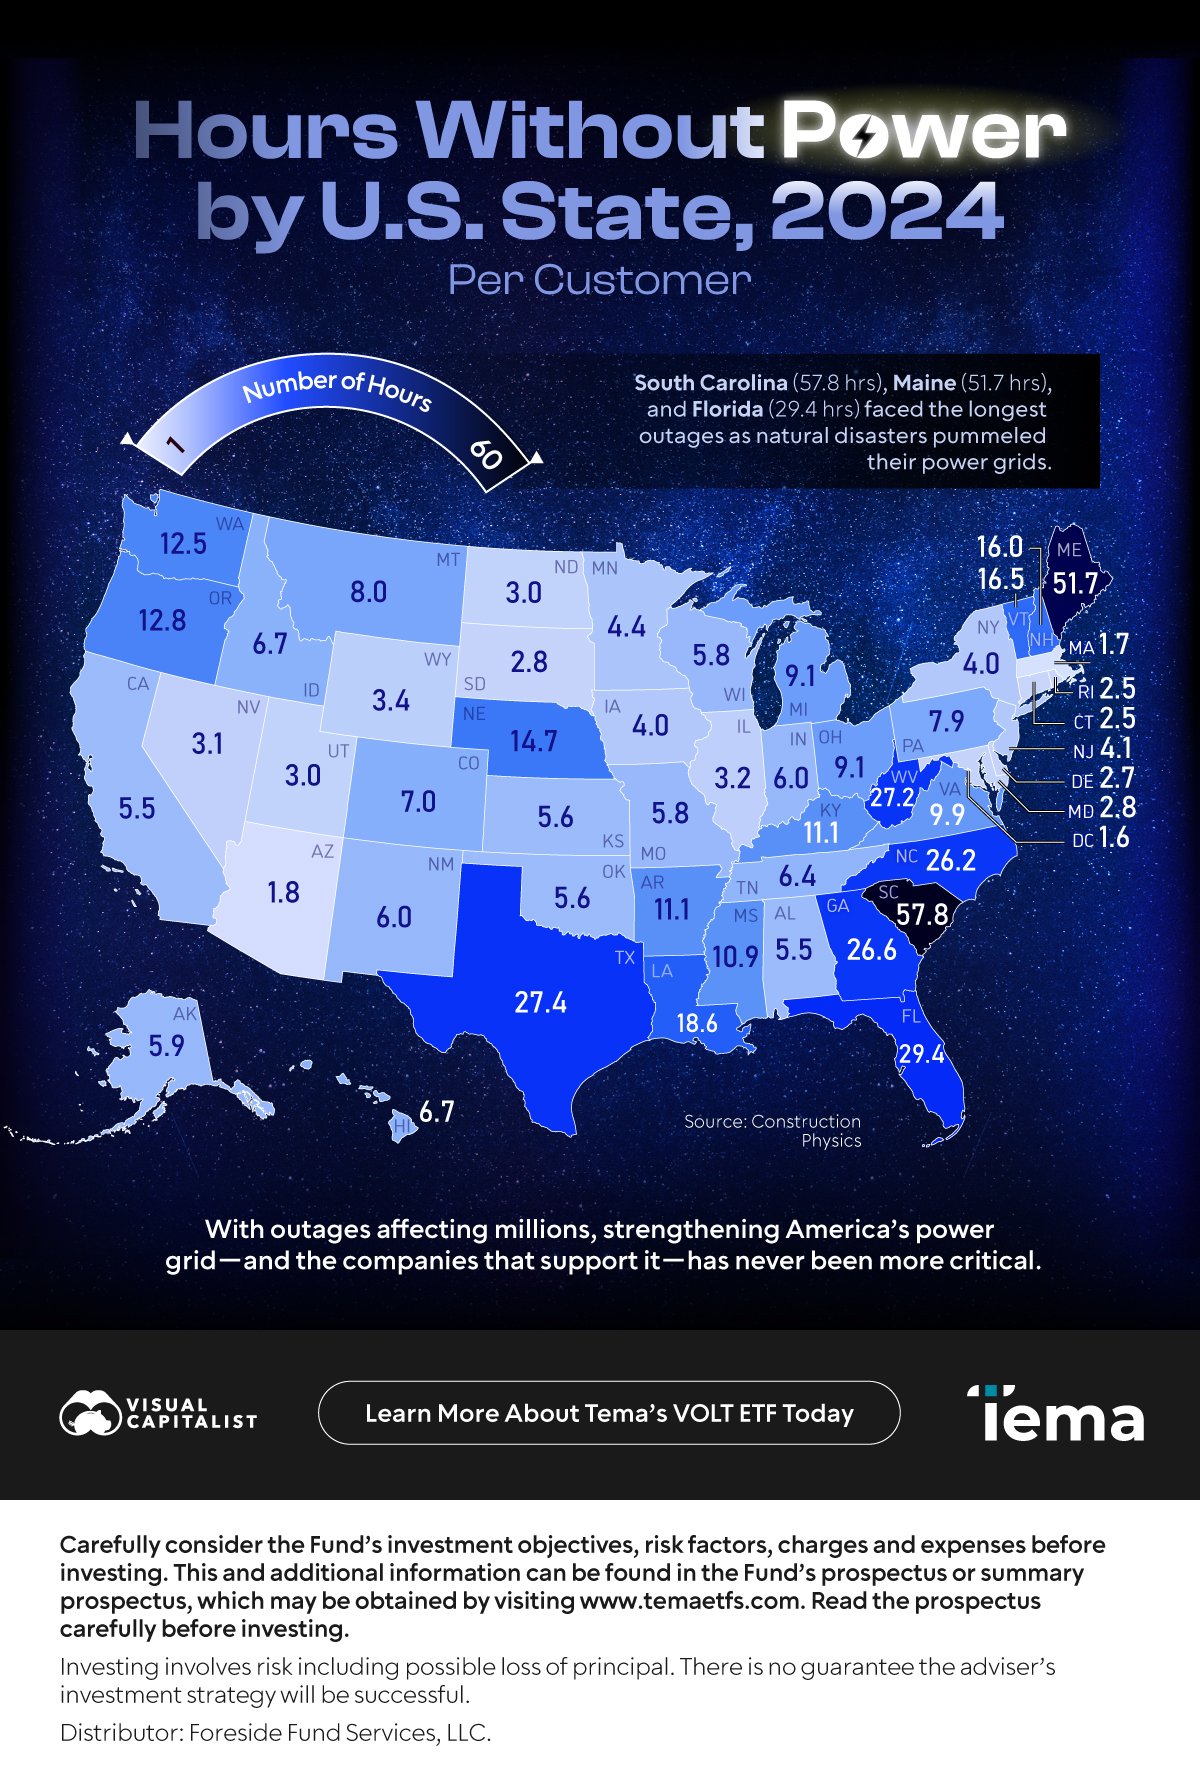
In partnership with Tema ETFs as part of VOLTage Week, this visualization illustrates the average hours that customers in each state went without power in 2024. The data reveals stark geographic disparities—while also underscoring a worsening national challenge.
The U.S. Power Grid
The U.S. power grid consists of a vast network of transmission and distribution lines that link electricity providers directly to consumers. In the continental U.S., this grid operates through three main systems: the Eastern Interconnect, the Western Interconnect, and the Texas Interconnect.
Engineers built much of the system in the 1960s and 1970s. Today, it urgently needs upgrades. Although the government has made improvements, the aging infrastructure struggles to keep pace with rising electricity demand. According to energy.gov, 70% of transmission lines are more than 25 years old. As a result, they are nearing the end of their typical lifecycle.
The ASCE’s 2025 infrastructure report card warns that the U.S. must increase distribution transformer capacity by 160%–250% by 2050 to meet projected needs. Yet supply chain bottlenecks continue to hinder the country’s ability to add transformers to the grid.
Power Disruptions by State
Deteriorating infrastructure has made power disruptions and outages increasingly common. From 2023 to 2024, the average U.S. electricity customer experienced more downtime, with outage hours rising from 7.7 to 10.6. This is a 38% jump in just one year.
| State | 2024 (hours) |
|---|---|
| Alabama | 5.5 |
| Alaska | 5.9 |
| Arizona | 1.8 |
| Arkansas | 11.1 |
| California | 5.5 |
| Colorado | 7.0 |
| Connecticut | 2.5 |
| Delaware | 2.7 |
| District of Columbia | 1.6 |
| Florida | 29.4 |
| Georgia | 26.6 |
| Hawaii | 6.7 |
| Idaho | 6.7 |
| Illinois | 3.2 |
| Indiana | 6.0 |
| Iowa | 4.0 |
| Kansas | 5.6 |
| Kentucky | 11.1 |
| Louisiana | 18.6 |
| Maine | 51.7 |
| Maryland | 2.8 |
| Massachusetts | 1.7 |
| Michigan | 9.1 |
| Minnesota | 4.4 |
| Mississippi | 10.9 |
| Missouri | 5.8 |
| Montana | 8.0 |
| Nebraska | 14.7 |
| Nevada | 3.1 |
| New Hampshire | 16.0 |
| New Jersey | 4.1 |
| New Mexico | 6.0 |
| New York | 4.0 |
| North Carolina | 26.2 |
| North Dakota | 3.0 |
| Ohio | 9.1 |
| Oklahoma | 5.6 |
| Oregon | 12.8 |
| Pennsylvania | 7.9 |
| Rhode Island | 2.5 |
| South Carolina | 57.8 |
| South Dakota | 2.8 |
| Tennessee | 6.4 |
| Texas | 27.4 |
| Utah | 3.0 |
| Vermont | 16.5 |
| Virginia | 9.9 |
| Washington | 12.5 |
| West Virginia | 27.2 |
| Wisconsin | 5.8 |
| Wyoming | 3.4 |
Additionally, outages grew worse in 30 states during 2024. South Carolina (57.8 hours), Maine (51.7 hours), and Florida (29.4 hours) recorded the highest average hours per customer, as natural disasters battered their electricity systems.
By contrast, the District of Columbia (1.6 hours), Massachusetts (1.7 hours), and Arizona (1.8 hours) reported some of the lowest outage times. These disparities highlight how unevenly the nation’s power grid problem affects different regions.
Powering the Nation
America’s aging power grid and the rise in disruptions highlight an urgent need for large-scale investment and modernization. This is creating a compelling opportunity to invest in U.S. electricity companies positioned to drive the transition.
The Tema Electrification ETF (VOLT) invests in the companies powering the future —from energy generation to grid modernization and power management technologies. Electrify your portfolio.

Learn more about VOLT.
Source: Construction Physics (2024)
Carefully consider the Fund’s investment objectives, risk factors, charges and expenses before investing. This and additional information can be found in the Fund’s prospectus or summary prospectus, which may be obtained by visiting www.temaetfs.com. Read the prospectus carefully before investing
Investing involves risk including possible loss of principal. There is no guarantee the adviser’s investment strategy will be successful.
Distributor: Foreside Fund Services, LLC.
-
 Markets3 days ago
AI Is Powering a New Electricity Boom
AI is booming, but so is its energy appetite. We break it down in this VOLTage Week post.
-
 Energy4 days ago
Which Sources Will Dominate U.S. Electricity Use? (2024-2050)
VOLTage Week: Which sources are likely to drive the upcoming electricity surge?
-
 Economy2 months ago
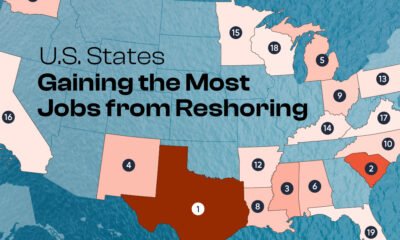
Ranked: U.S. States Gaining the Most Jobs from Reshoring
As the reshoring trend accelerates, millions of manufacturing jobs are returning to American soil. But the benefits aren’t being shared equally across the country.
-
 Economy3 months ago
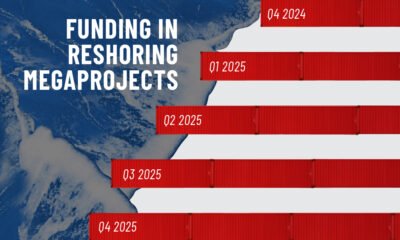
Visualized: Reshoring Investments in the U.S. Have Surged to $1.7T
Reshoring began with supply chain disruptions and sluggish job growth—now it’s gaining momentum with the White House.
-

 Markets4 months ago
Ranked: 2025’s 10 Largest S&P 500 Stocks
When you invest in S&P 500 stocks, you’re gaining exposure to the 500 biggest publicly traded companies in the U.S.—but not equally.
-

 Economy4 months ago
Ranked: America’s $425B Trade Deficit by Product
See which goods drive America’s $425B trade deficit—and why they signal key opportunities for U.S. reshoring and domestic investment.
-

 Markets4 months ago
Visualized: The Rising Concentration of the S&P 500
By early 2025, the top ten companies in the S&P 500 made up nearly 40%, marking a high degree of market concentration.
-
 Markets4 months ago
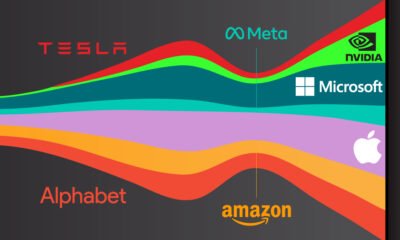
The Surging Value of the Magnificent 7 Versus the S&P 500 (2014-2024)
The Magnificent 7 stocks have soared from $1.8T in 2014 to over $18T by 2024—but is their growing dominance making the S&P 500 concentrated?