Ranked: States With the Highest Homelessness Rates
See visuals like this from many other data creators on our Voronoi app. Download it for free on iOS or Android and discover incredible data-driven charts from a variety of trusted sources.
Key Takeaways
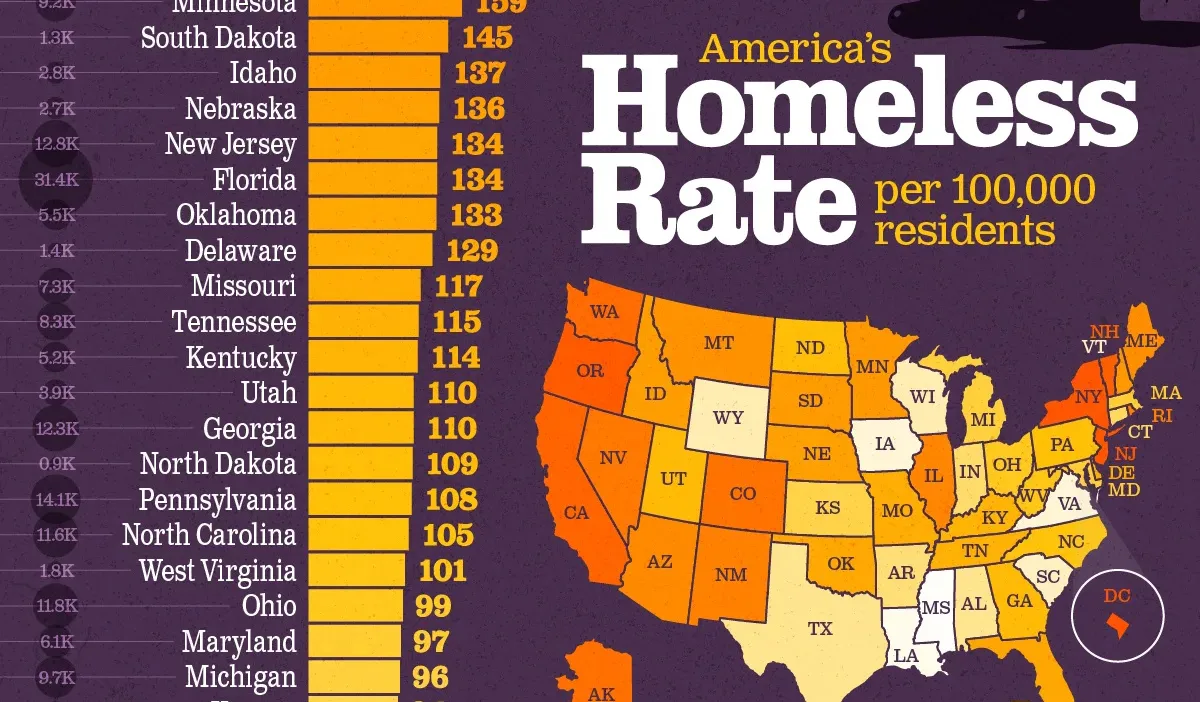
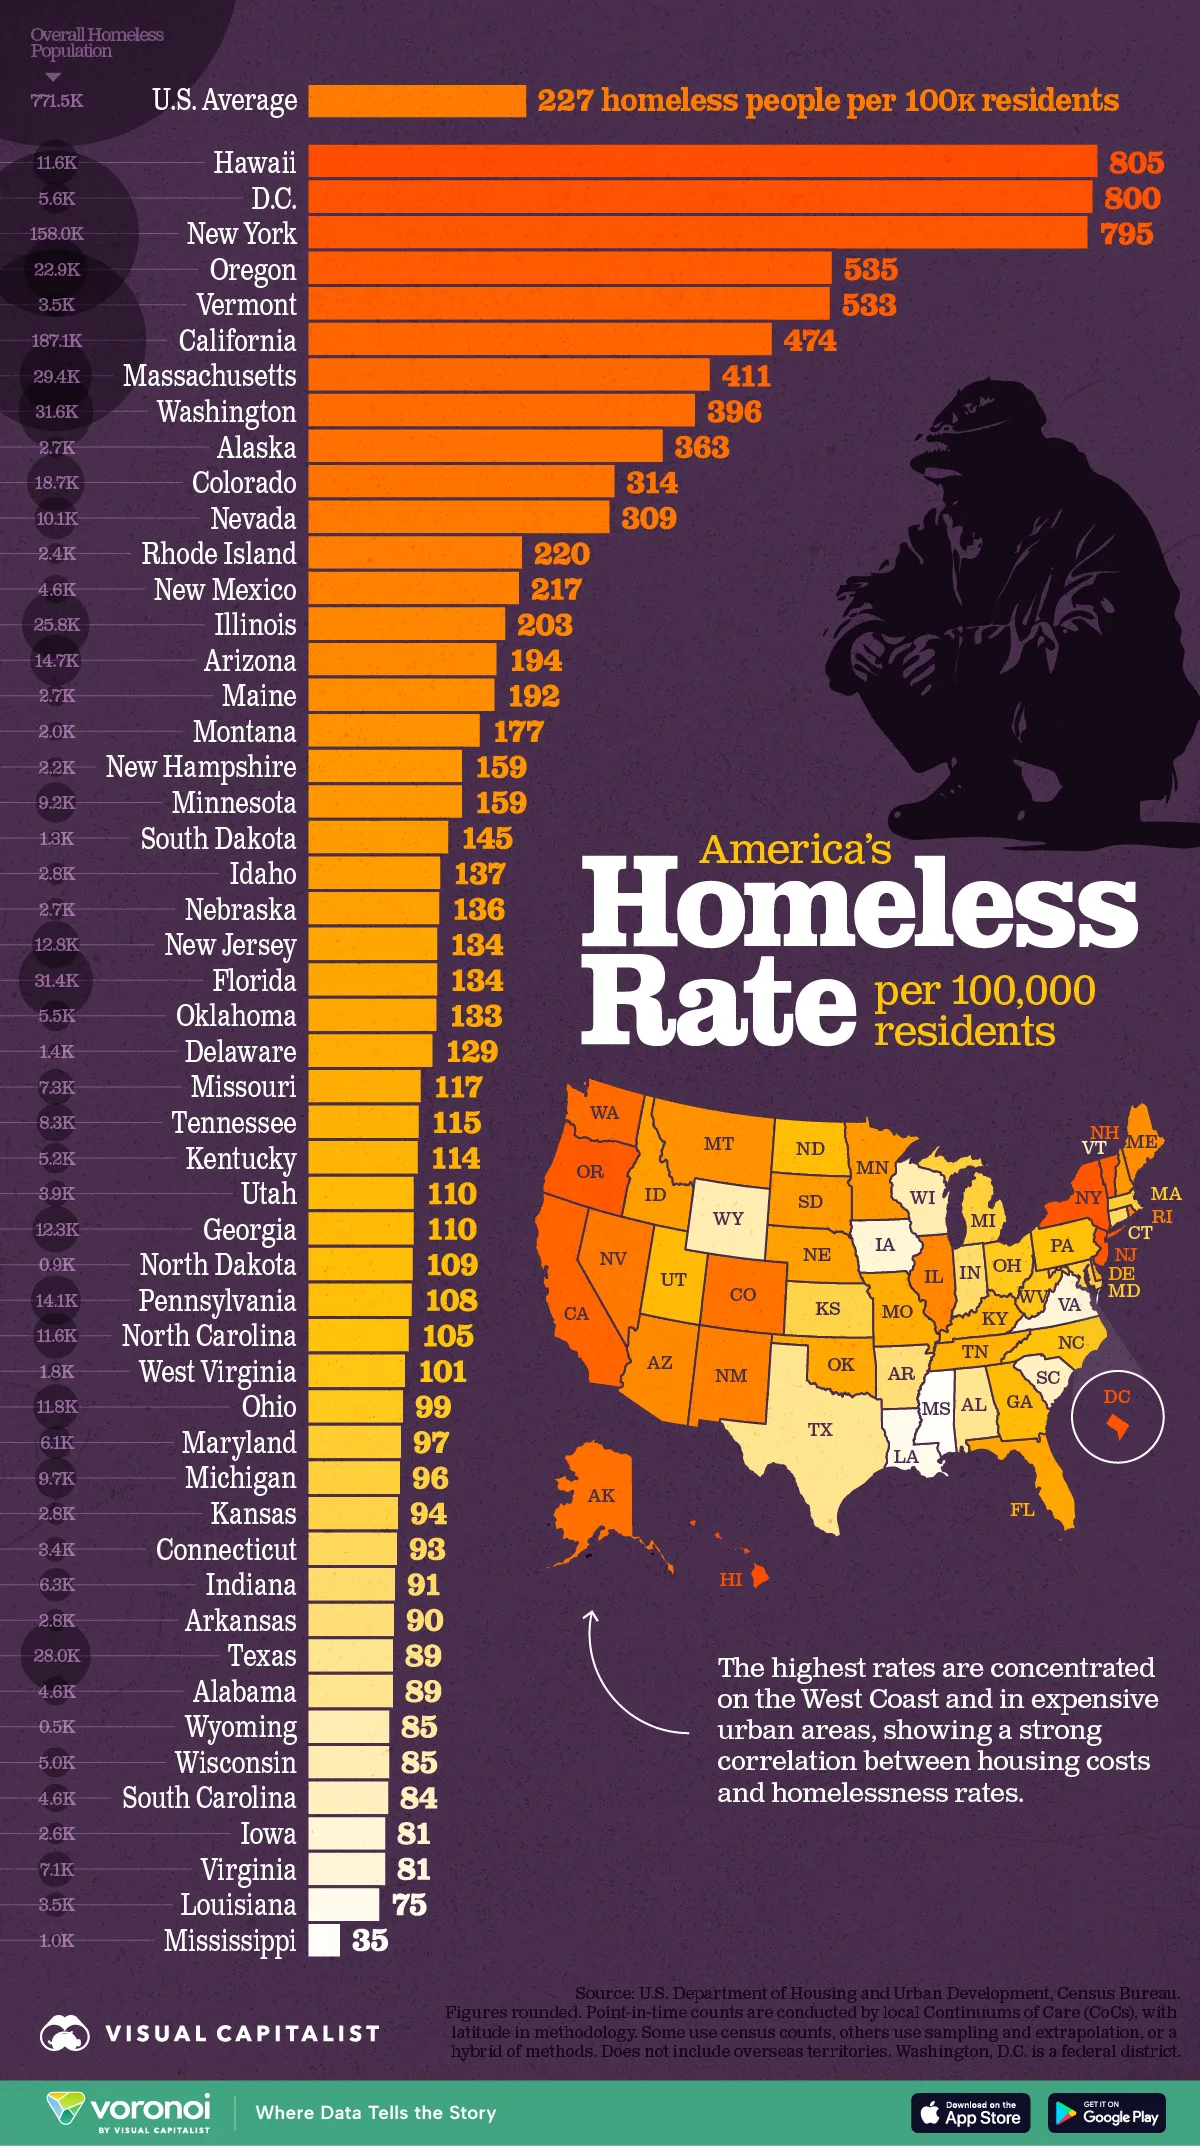
- Hawaii experiences the highest homelessness rate in the country at 805 people per 100,000 residents, followed by Washington, D.C. (800) and New York (795).
- The data shows a strong correlation between housing costs and homelessness rates.
There are around 772,000 homeless Americans (nearly 230 for ever 100,000 Americans), according to the last time a point-in-count assessment was done in 2024.
In this visualization, we take a look at the highest homelessness rates by state, measured per 100,000 residents.
The data for this visualization comes from the U.S. Department of Housing and Urban Development, paired with 2024 population estimates from the U.S. Census Bureau.
 Caveats: Point-in-time counts were conducted in January, 2024 by local Continuums of Care (CoCs), with latitude in methodology. They risk undercounting unsheltered populations, people couch‑surfing, or those avoiding contact.
High Housing Costs & Homelessness
Hawaii tops the ranking with 805 people experiencing homelessness for every 100,000 residents.
This is more than three times the national average of 227.
| Rank | State | State Code | Homelessness per 100,000 Residents |
Overall Homeless Population |
|---|---|---|---|---|
| 1 | Hawaii | HI | 805 | 11,637 |
| 2 | District of Columbia | DC | 800 | 5,616 |
| 3 | New York | NY | 795 | 158,019 |
| 4 | Oregon | OR | 535 | 22,875 |
| 5 | Vermont | VT | 533 | 3,458 |
| 6 | California | CA | 474 | 187,084 |
| 7 | Massachusetts | MA | 411 | 29,360 |
| 8 | Washington | WA | 396 | 31,554 |
| 9 | Alaska | AK | 363 | 2,686 |
| 10 | Colorado | CO | 314 | 18,715 |
| 11 | Nevada | NV | 309 | 10,106 |
| 12 | Rhode Island | RI | 220 | 2,442 |
| 13 | New Mexico | NM | 217 | 4,631 |
| 14 | Illinois | IL | 203 | 25,832 |
| 15 | Arizona | AZ | 194 | 14,737 |
| 16 | Maine | ME | 192 | 2,702 |
| 17 | Montana | MT | 177 | 2,008 |
| 18 | New Hampshire | NH | 159 | 2,245 |
| 19 | Minnesota | MN | 159 | 9,201 |
| 20 | South Dakota | SD | 145 | 1,338 |
| 21 | Idaho | ID | 137 | 2,750 |
| 22 | Nebraska | NE | 136 | 2,720 |
| 23 | New Jersey | NJ | 134 | 12,762 |
| 24 | Florida | FL | 134 | 31,362 |
| 25 | Oklahoma | OK | 133 | 5,467 |
| 26 | Delaware | DE | 129 | 1,358 |
| 27 | Missouri | MO | 117 | 7,312 |
| 28 | Tennessee | TN | 115 | 8,280 |
| 29 | Kentucky | KY | 114 | 5,231 |
| 30 | Utah | UT | 110 | 3,869 |
| 31 | Georgia | GA | 110 | 12,290 |
| 32 | North Dakota | ND | 109 | 865 |
| 33 | Pennsylvania | PA | 108 | 14,088 |
| 34 | North Carolina | NC | 105 | 11,626 |
| 35 | West Virginia | WV | 101 | 1,779 |
| 36 | Ohio | OH | 99 | 11,759 |
| 37 | Maryland | MD | 97 | 6,069 |
| 38 | Michigan | MI | 96 | 9,739 |
| 39 | Kansas | KS | 94 | 2,793 |
| 40 | Connecticut | CT | 93 | 3,410 |
| 41 | Indiana | IN | 91 | 6,285 |
| 42 | Arkansas | AR | 90 | 2,783 |
| 43 | Texas | TX | 89 | 27,987 |
| 44 | Alabama | AL | 89 | 4,601 |
| 45 | Wyoming | WY | 85 | 501 |
| 46 | Wisconsin | WI | 85 | 5,049 |
| 47 | South Carolina | SC | 84 | 4,593 |
| 48 | Iowa | IA | 81 | 2,631 |
| 49 | Virginia | VA | 81 | 7,141 |
| 50 | Louisiana | LA | 75 | 3,469 |
| 51 | Mississippi | MS | 35 | 1,041 |
| N/A | U.S. | USA | 227 | 771,480 |
Washington, D.C. is next at 800, reflecting the high cost of living and limited affordable housing in the nation’s capital.
New York ranks third at 795, driven largely by the concentrated shelter population in New York City.
Together, these three jurisdictions account for nearly 175,000 unhoused individuals.
West Coast Living Costs Pressures Push Numbers Higher
Four West Coast states—Oregon, California, Washington, and Alaska—sit firmly in the top 10.
Oregon’s rate has climbed to 535 amid rising rents in Portland, while California’s 187,000 unhoused people represent the largest absolute total in the country.
Seattle’s booming technology sector and limited housing supply help push Washington to nearly 400 per 100,000.
These states share a common thread: home prices that have consistently outpaced wage growth, leaving some residents on the brink of housing insecurity.
 Related: Look at the newest data around average house prices in each U.S. state.
Southern and Midwestern States See Lower Rates
At the opposite end of the spectrum, Southern and Midwestern states generally report far lower rates.
Mississippi posts the lowest figure—just 35 people per 100,000—followed by Louisiana (75) and Virginia (81).
Lower housing costs, sprawling land availability, and fewer large metro areas likely contribute to these lower rates, although undercounts in rural regions remain a challenge.
Even populous states such as Texas and Florida fall near the middle of the pack at 89 and 134 respectively, showing that population alone does not dictate homelessness levels.
Overall, the data underscore a powerful link between housing affordability and homelessness. States with soaring rents and tight markets consistently rank higher, while those with more modest housing costs tend to fare better.
Learn More on the Voronoi App 
For more related coverage, check out The World’s Most Unaffordable Housing Markets on Voronoi, the new app from Visual Capitalist.