About 18 months ago, we launched Voronoi, our free new data discovery app.
Believe it or not, there are already more data-driven visuals on Voronoi than on Visual Capitalist (which has been around for 13 years!).
Every day there’s something new on Voronoi to see. And in aggregate, there are roughly 6,500 data stories to explore on the platform from 175+ world-class creators.
Let’s see what captured the attention of users in October.
Below are the month’s standout visuals on Voronoi — including the most discussed, most viewed, most liked, and our editor’s pick.
MOST DISCUSSED
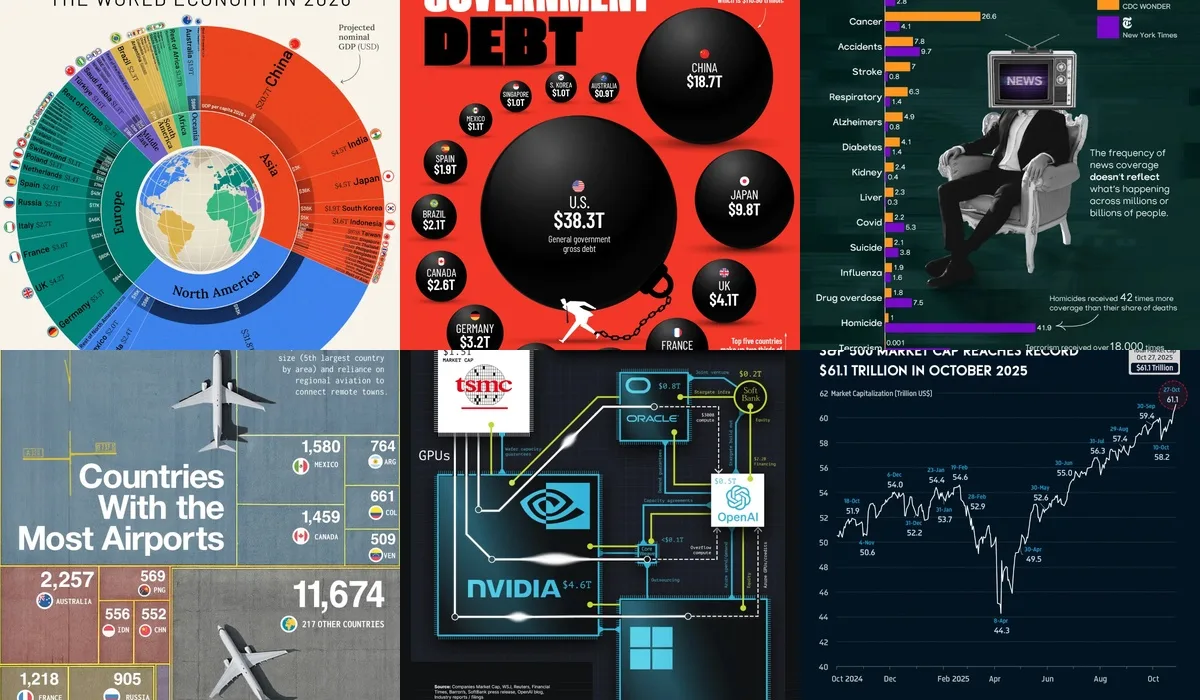
Countries With the Most Airports in 2025 
This month’s most discussed visualization came from Visual Capitalist, highlighting which countries have the greatest number of airports around the world.
The U.S. leads by a staggering margin—with more than three times as many airports as second-place Brazil. Large, geographically dispersed countries like Australia and Canada also rank high due to their dependence on air connectivity.
What surprised many users most, however, was China’s relatively low number of airports, a reflection of its extensive high-speed rail network reducing domestic flight demand.
Even Antarctica makes the list, with 35 small or seasonal airstrips serving research and logistics bases—though none operate commercial routes.
 Join the discussion on Voronoi today.
MOST VIEWED
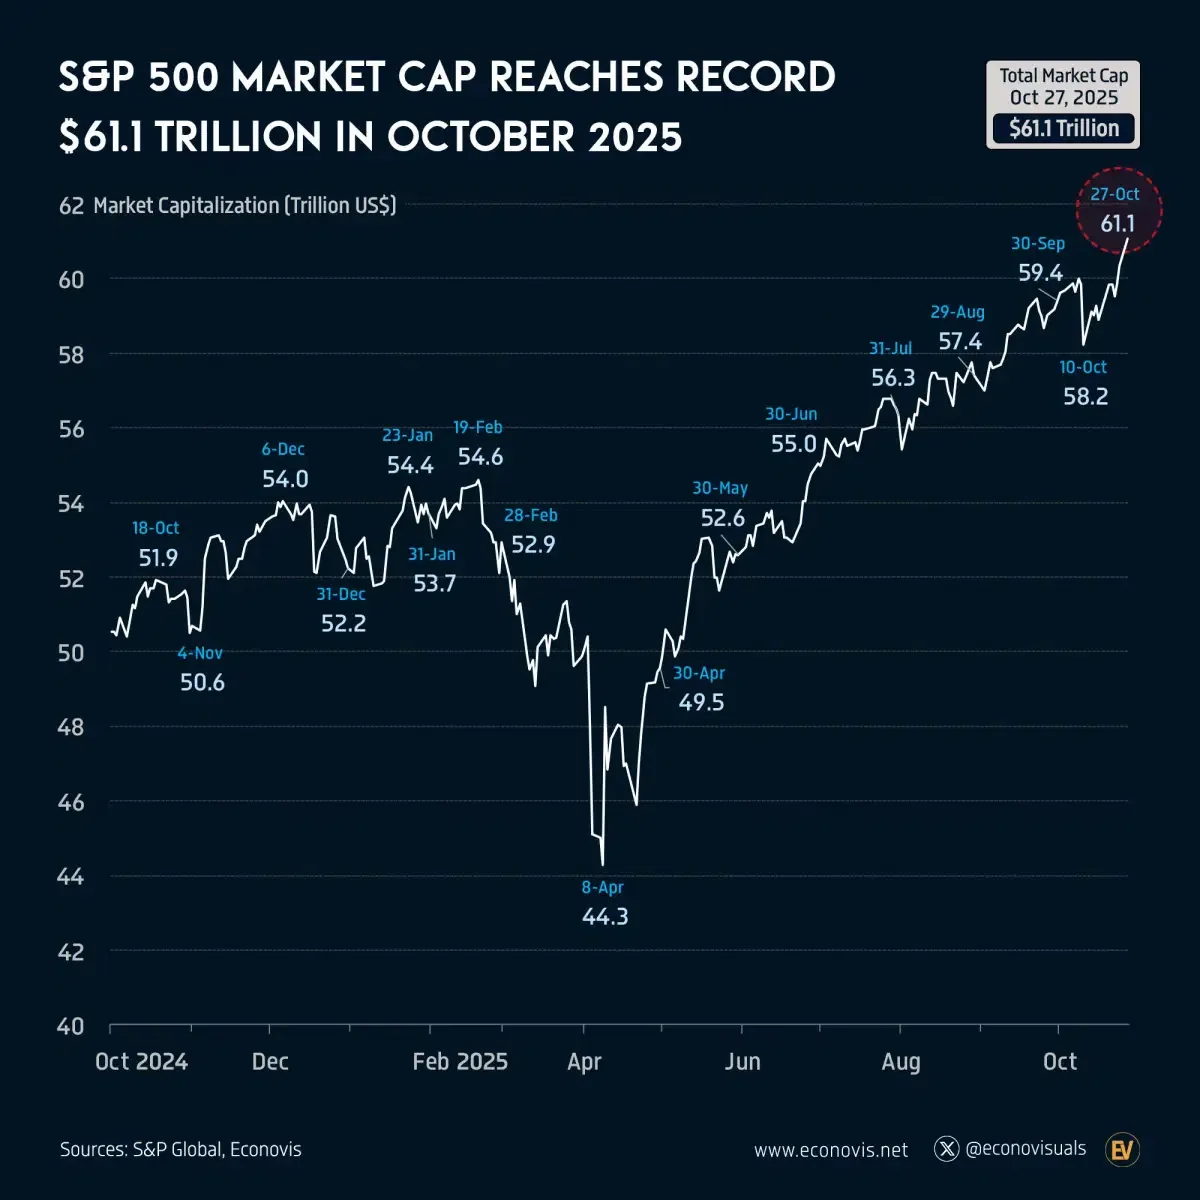
The GPU Pipeline Visualized
One of the month’s most technically rich and widely viewed visuals came from MadeVisual, revealing the complex web of relationships behind the world’s GPU supply chain.

This detailed map follows how compute power flows from fabrication (TSMC) to chip design (Nvidia) to deployment via cloud giants like Microsoft and Oracle, and ultimately, to AI labs like OpenAI.
It’s a story of power and scarcity: whoever controls GPU access controls the pace of progress. Multi-billion dollar contracts and exclusivity deals now define who can scale models, and who must wait in line.
Explore the full visualization on Voronoi today.
MOST LIKED
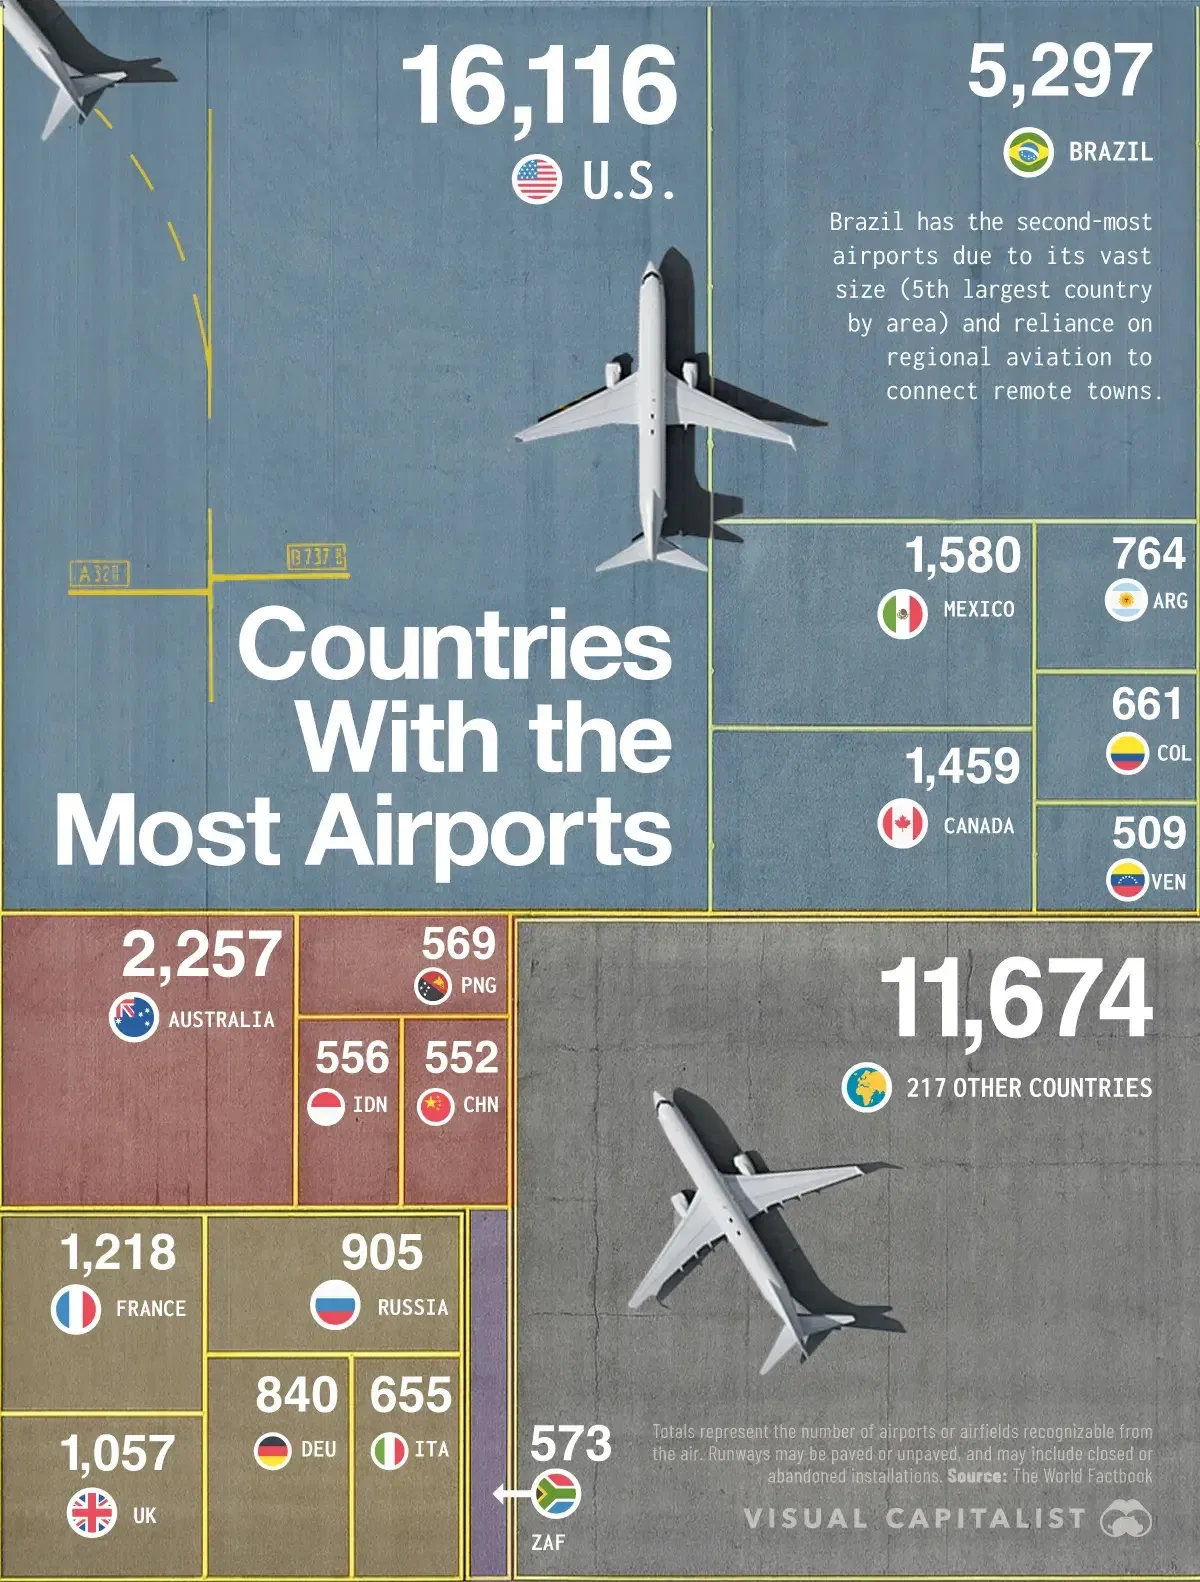
Causes of Death: Official Statistics vs. Media Share
This thought-provoking piece by Iryna Suprun resonated deeply with users, illustrating how public perception of danger diverges sharply from reality.
While chronic diseases like heart disease and cancer cause the overwhelming majority of deaths, they receive relatively little media coverage. Meanwhile, rare but dramatic events, such as homicides or terrorist attacks, dominate headlines and public consciousness.
The visualization explores how this mismatch is sustained by media incentives: stories that are personal, visual, and emotionally charged attract more clicks and engagement, creating a cycle where rare tragedies overshadow persistent health crises.
See the full breakdown on Voronoi today.
EDITOR’S PICK
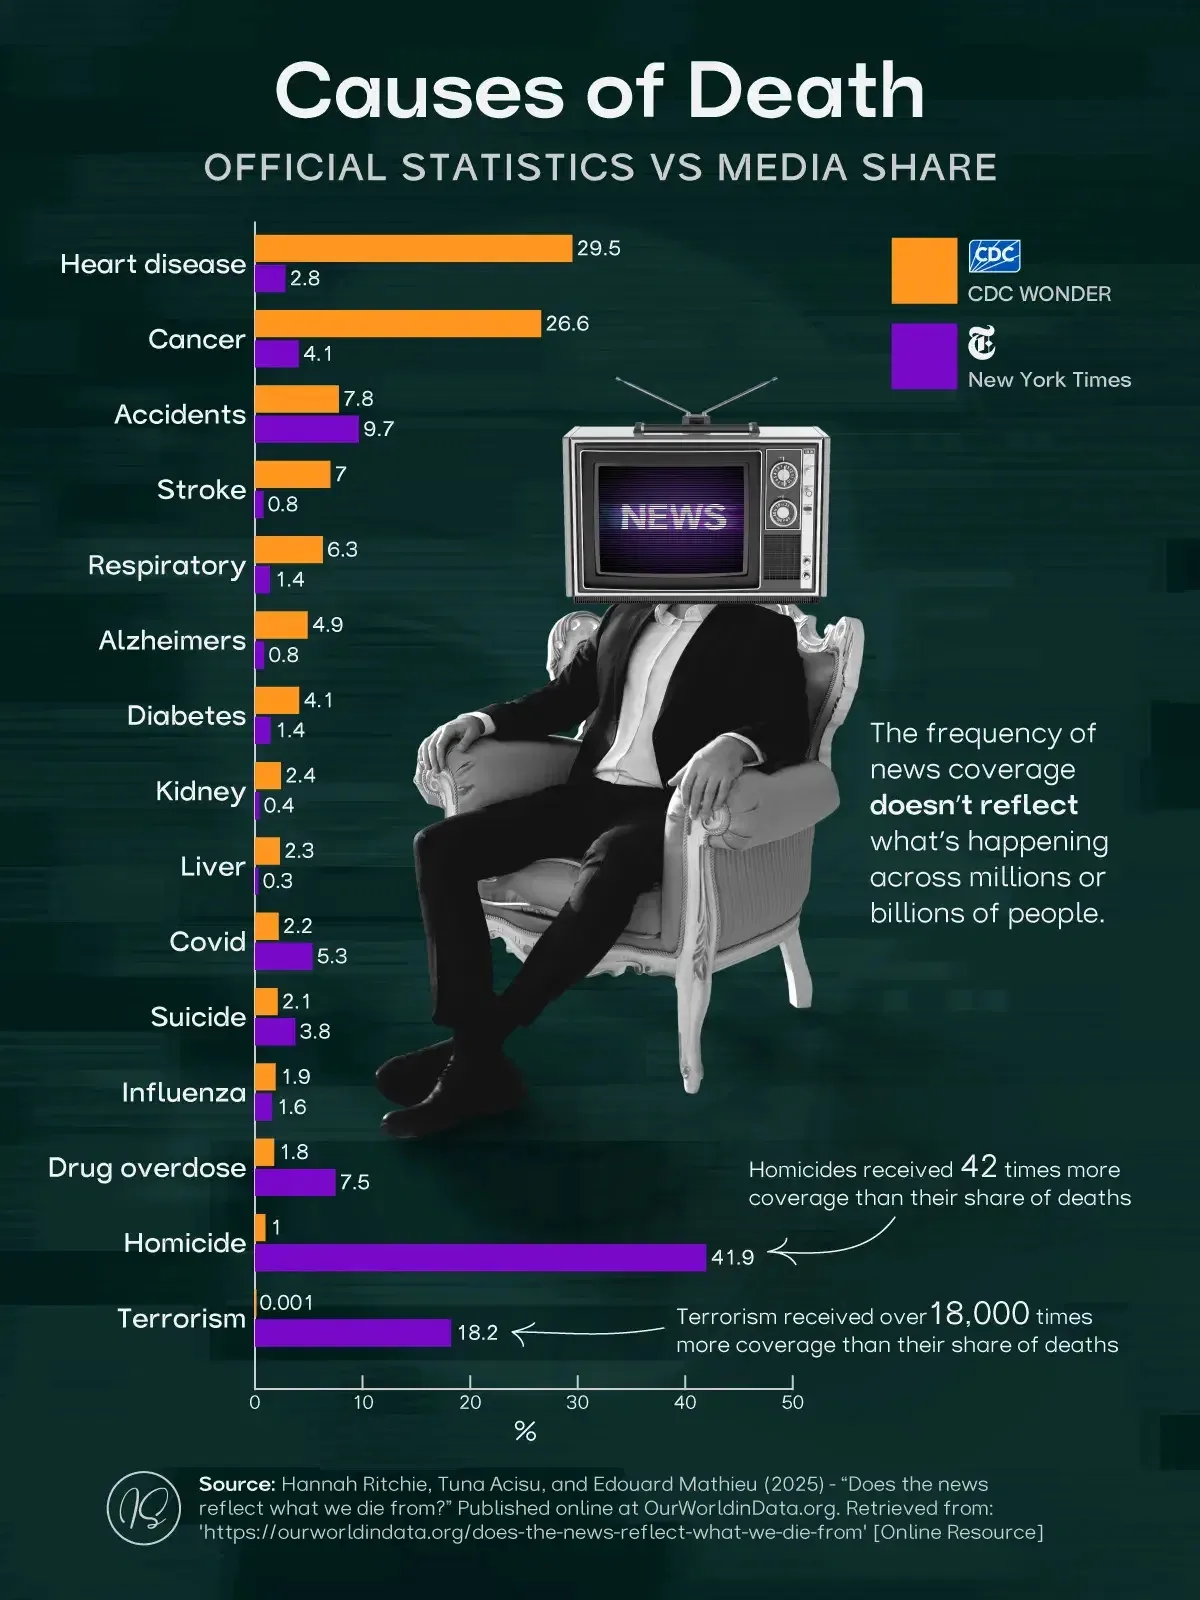
 S&P 500 Market Cap Reaches Record $61.1 Trillion in Oct. 2025
For our Editor’s Pick, Ehsan Soltani charted the S&P 500’s latest milestone: a record total market capitalization of $61.1 trillion as of October 27, 2025.
The index has climbed 16.9% year-to-date, buoyed by strong earnings, optimism over easing U.S.–China trade tensions, and expectations of a coming Federal Reserve rate cut. Tech stocks once again led this month—with Qualcomm up 11%, Tesla up 4.3%, and Nvidia up 2.8%.
It’s a striking snapshot of market confidence and how concentrated growth in tech continues to push U.S. equities to historic highs.
Explore the visualization on Voronoi today.
- Source: https://www.visualcapitalist.com/the-best-visualizations-of-october-2025-on-the-voronoi-app/