Mapped: How Much Does NATO Spend of Defense Technology?
Key Takeaways
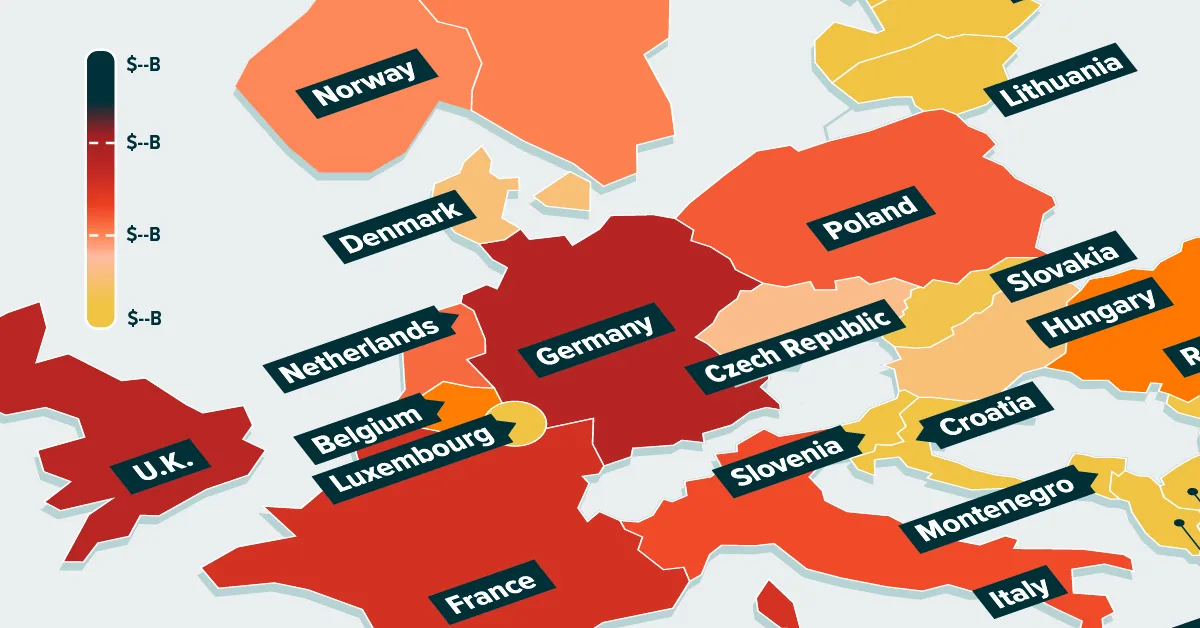
- In 2024, NATO defense technology spending would total $290 billion if the Wales pledge were met, 30% higher than 2019.
- The U.S. would lead with $193.6 billion, accounting for 66% of total spending.
- Europe’s big four (Germany, U.K., France, Italy) would together account for $53 billion.
Defense technology is increasingly important in modern militaries. Specialized and advanced equipment, including sensors, radar, networking, and even artificial intelligence, is now commonplace on today’s battlefields.
In this graphic, the second in the Investing in Defense series, we partnered with Global X ETFs to examine NATO’s potential defense technology spending.
The 2014 Wales Summit
Among the many things discussed and agreed upon at NATO’s 2014 Summit in Newport, Wales, the allied nations agreed to spend at least 20% of their budgets on developing and procuring new technologies.
By examining each nation’s 2024 defense budget, we can estimate the amount each NATO nation spends on defense tech.
If NATO nations had exactly met their Wales Summit pledge, the bloc would have spent around $290 billion on defense technology in 2024–30% more than in 2019.
Here’s how this breaks down by nation:
| Nation | Defense Tech Spend |
|---|---|
 U.S. U.S. |
$193.6B |
 Germany Germany |
$17.2B |
 United Kingdom United Kingdom |
$16.2B |
 France France |
$12.8B |
 Italy Italy |
$7.0B |
 Poland Poland |
$5.6B |
 Canada Canada |
$5.4B |
 Netherlands Netherlands |
$4.7B |
 Spain Spain |
$3.9B |
 Türkiye Türkiye |
$2.9B |
 Sweden Sweden |
$2.5B |
 Norway Norway |
$2.0B |
 Romania Romania |
$1.8B |
 Belgium Belgium |
$1.7B |
 Greece Greece |
$1.6B |
 Finland Finland |
$1.4B |
 Czechia Czechia |
$1.3B |
 Hungary Hungary |
$1.1B |
 Denmark Denmark |
$1.1B |
 Portugal Portugal |
$0.6B |
 Slovakia Slovakia |
$0.6B |
 Lithuania Lithuania |
$0.5B |
 Bulgaria Bulgaria |
$0.5B |
 Estonia Estonia |
$0.3B |
 Latvia Latvia |
$0.3B |
 Croatia Croatia |
$0.3B |
 Slovenia Slovenia |
$0.2B |
 Luxembourg Luxembourg |
$0.1B |
 Albania Albania |
$0.1B |
 North Macedonia North Macedonia |
$0.1B |
 Montenegro Montenegro |
$0.1B |
 Iceland Iceland |
$0.01B |
The U.S. would have led this spending and contributed 66% to this estimated technology spend.
The Importance of Technology in Defense
Modern networks run today’s battlefields, and militaries deploy advanced machinery such as drones, sensors, and artificial intelligence.
Consequently, governments are increasing spending on these defense technologies which span a wide variety of sectors. They cover everything from industrials and robotics to cybersecurity and augmented reality.
A Differentiated Exposure
By investing in defense tech, investors gain exposure to a distinct market.
Governments, largely disconnected from economic cycles, procure more of these technologies each year and offer a meaningful diversification benefit to investors.
The Global X SHLD ETF provides investors with exposure to companies, including those in the AI and big data sectors, that are well-positioned to benefit from the adoption of defense tech.
In the third and final part of the Investing in Defense series, we will discover exactly how much the U.S. Department of Defense spends on defense technology.

Learn more about the Global X Defense Technology ETF (SHLD).
-

 Politics7 hours ago
Charted: U.S. Department of Defense Technology Spending: 2020 vs 2026
Department of Defense tech spend to rise to a $384B FY2026 request, up 71% vs 2020. Which programs gained most and which fell?
-

 Politics11 hours ago
Global Defense Spending in 2024
Defense spending rose to $2.5T in 2024, up from $2.2T in 2023. How does North America’s spending compare with other regions?
-

 Economy2 weeks ago
Ranked: P/E Ratios in Emerging vs. Developed Markets
Emerging markets P/E ratios trade at a 30%+ discount to developed peers. Which countries are most undervalued today?
-

 Economy2 weeks ago
Charted: Foreign Direct Investment in Emerging Markets
Emerging Markets drew $430B in foreign direct investment in 2022, outpacing global growth. How have these trends evolved over time?
-

 Economy2 weeks ago
Mapped: Population of Emerging Markets
Emerging Markets are countries transitioning from developing to developed status. How significant are they in terms of global population?
-

 Markets2 months ago
Charted: The Rising Share of U.S. Data Center Power Demand
As advanced AI adoption surges, U.S. data center demand is projected to reach nearly 12% of the nation’s power.
-

 Markets2 months ago
What’s Driving America’s Growing Electricity Demand?
The U.S. EIA believes that by 2050, U.S. power demand will surge by nearly 50%.
-

 Energy2 months ago
Breaking Down America’s $3.7 Trillion Infrastructure Funding Gap
Despite many government efforts to modernize U.S. infrastructure, the funding gap stood at a staggering $3.7 trillion in 2025.
-

 Politics4 months ago
Breaking Down the West’s $146 Billion 2024 Defence Technology Investment
Visual Capitalist has partnered with Global X ETFs to break down the $146 billion spent on defence technology by the U.S. and the EU.
-

 Politics4 months ago
Mapped: How NATO Defence Spending Has Changed Since the Ukraine-Russia War
Visual Capitalist has partnered with Global X ETFs to explore how NATO defence spending has changed since the start of the Ukrain-Russia war.
-

 Politics4 months ago
Visualized: Global Defence Spending in 2024
Visual Capitalist has partnered with Global X ETFs to explore global defence spending and find out which nation spends the most on defence.
-

 Economy5 months ago
Breaking Down the 117th Congress’s $1.2T Infrastructure Investment
Graphic showing U.S. infrastructure investment highlighting that investment is primarily going to roads, bridges, and other major projects.
-

 Economy5 months ago
Report Card: Grading U.S. Infrastructure
This graphic shows U.S infrastructure grades and highlights the general low grade.
-

 Energy10 months ago
Nuclear Energy Supply Forecast by Region
Visual Capitalist and Global X partnered to explore global nuclear energy demand, and how it’s changing, in the coming years.
-

 Energy10 months ago
Charted: $300 Billion in Global Nuclear Energy Investment
Visual Capitalist and Global X partnered to explore nuclear energy investment and find out which regions spent the most on nuclear power.
-

 Energy10 months ago
Visualized: Nuclear Energy Generation by Region
Visual Capitalist and Global X ETFs explore regional nuclear energy generation and why nuclear energy is critical to the energy transition.
-

 Technology1 year ago
Ranked: Which Countries Have the Most Data Centers?
For this graphic, Visual Capitalist partnered with Global X ETFs to rank the nations by the number of data centers they currently operate.
-

 Technology1 year ago
Charted: How Much Data is Stored Online?
For this graphic, Visual Capitalist has partnered with Global X ETFs to explore online data generation and show how much data could be generated between 2015…
-

 Technology1 year ago
Visualized: The Impact of AI on Revenue
In this graphic, Visual Capitalist has partnered with Global X ETFs to explore the financial impact of AI adoption across various industries.
-

 Green2 years ago
Mapped: U.S. Investment in Sustainable Infrastructure (2021-2023)
This graphic shows high levels of investment in U.S. clean infrastructure between 2021 and 2023.
-

 Technology2 years ago
Visualized: What is the Artificial Intelligence of Things?
Explore the explosive growth of the Artificial Intelligence of Things (AIoT) industry and its transformative impact across sectors.
-

 Technology2 years ago
A Visual Guide to AI Adoption, by Industry
AI adoption impacts many industries, with finance leading. Discover how AI tools optimize operations, mitigate risks, and drive growth.
-

 Technology2 years ago
Ranked: Artificial Intelligence Startups, by Country
Find out which countries are winning the race when it comes to the number of AI startups and private investment .
-

 Technology3 years ago
On the Road to Electric Vehicles
Electric vehicles are playing a key role in the decarbonization of road transport. But how much further do we need to go to hit net zero?
-

 Mining3 years ago
Should You Invest in Disruptive Materials?
Disruptive materials are experiencing a demand supercycle. See how these materials are helping revolutionize next generation technologies.
-

 Technology3 years ago
Thematic Investing: 3 Key Trends in Cybersecurity
Cyberattacks are becoming more frequent and sophisticated. Here’s what investors need to know about the future of cybersecurity.
- Source: https://www.visualcapitalist.com/sp/gx03-mapped-how-much-does-nato-spend-on-defense-technology/