Ranked: States Americans Are Moving To
See visuals like this from many other data creators on our Voronoi app. Download it for free on iOS or Android and discover incredible data-driven charts from a variety of trusted sources.
Key Takeaways
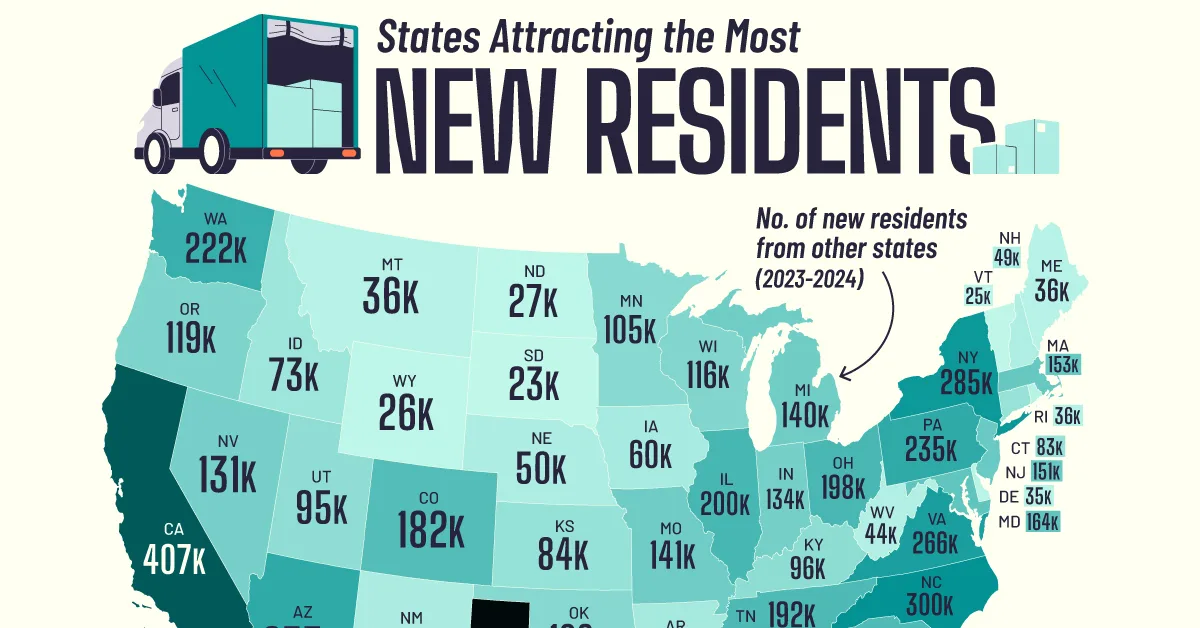
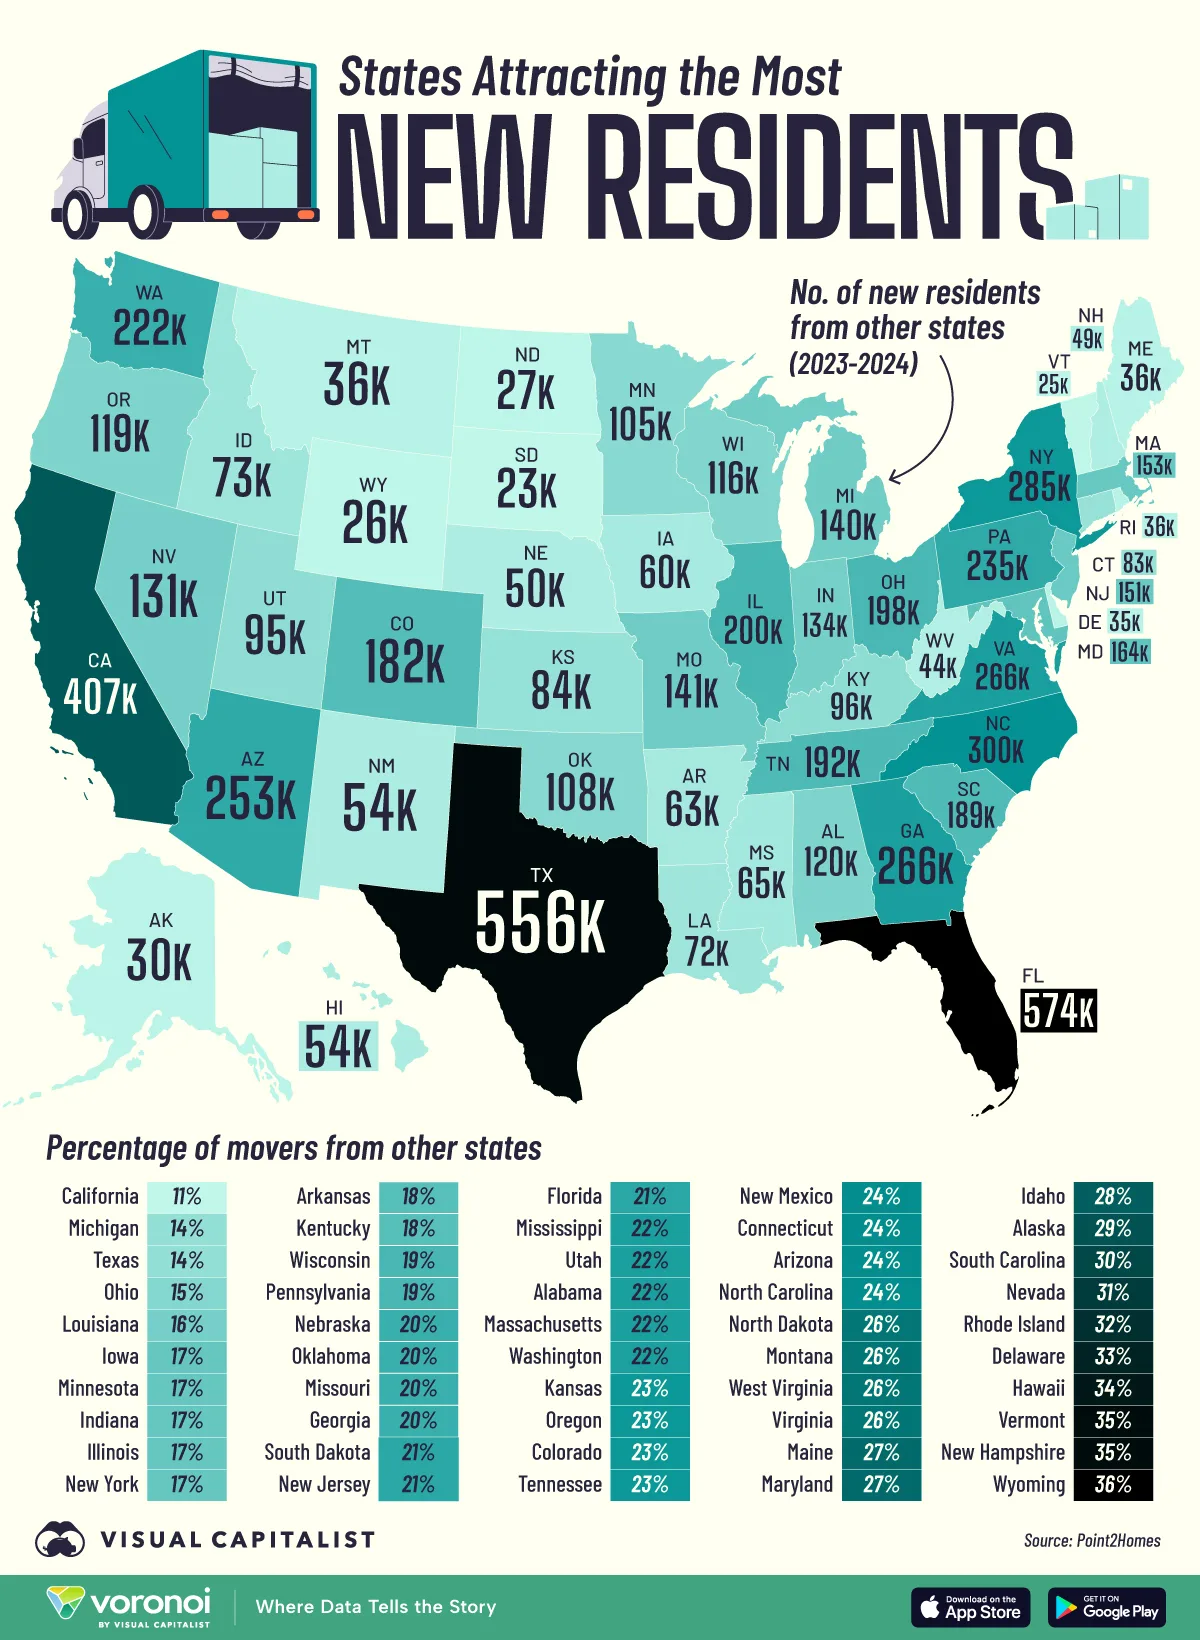
- Texas and Florida led the nation in attracting new residents between 2023 and 2024, each gaining over half a million newcomers from other states.
- While overall mobility in the U.S. has reached historic lows, southern and Sun Belt states continue to see strong domestic migration trends.
Nearly one in five Americans who moved between 2023 and 2024 relocated across state lines, marking one of the lowest national mobility rates in U.S. history. Still, migration patterns reveal clear regional winners, with people continuing to flock toward warmer, lower-cost states.
This visualization highlights the top destinations and origins of interstate movers, based on fresh data from Point2Homes. It shows where Americans are relocating and how these patterns reflect broader economic and demographic shifts.
Sun Belt States Dominate Migration Flows
Florida, California and Texas were the clear winners of interstate migration. Each attracted around half a million new residents from other states, with Florida’s 21% out-of-state share standing out.
| Rank | State | Total Movers | % From Out of State | Movers from Other States |
|---|---|---|---|---|
| 1 | Texas | 3,970,000 | 14% | 556K |
| 2 | California | 3,750,000 | 11% | 407K |
| 3 | Florida | 2,790,000 | 21% | 574K |
| 4 | New York | 1,670,000 | 17% | 285K |
| 5 | Georgia | 1,340,000 | 20% | 266K |
| 6 | Ohio | 1,330,000 | 15% | 198K |
| 7 | North Carolina | 1,250,000 | 24% | 300K |
| 8 | Pennsylvania | 1,240,000 | 19% | 235K |
| 9 | Illinois | 1,190,000 | 17% | 200K |
| 10 | Michigan | 1,030,000 | 14% | 140K |
| 11 | Virginia | 1,000,000 | 26% | 266K |
| 12 | Washington | 999,000 | 22% | 222K |
| 13 | Arizona | 971,000 | 24% | 235K |
| 14 | Tennessee | 831,000 | 23% | 192K |
| 15 | Colorado | 796,000 | 23% | 182K |
| 16 | Indiana | 768,000 | 17% | 134K |
| 17 | New Jersey | 735,000 | 21% | 151K |
| 18 | Missouri | 718,000 | 20% | 141K |
| 19 | Massachusetts | 694,000 | 22% | 153K |
| 20 | South Carolina | 640,000 | 30% | 189K |
| 21 | Wisconsin | 626,000 | 19% | 116K |
| 22 | Minnesota | 617,000 | 17% | 105K |
| 23 | Maryland | 616,000 | 27% | 164K |
| 24 | Alabama | 558,000 | 22% | 120K |
| 25 | Oklahoma | 548,000 | 20% | 108K |
| 26 | Oregon | 527,000 | 23% | 119K |
| 27 | Kentucky | 520,000 | 18% | 96K |
| 28 | Louisiana | 456,000 | 16% | 72K |
| 29 | Utah | 437,000 | 22% | 95K |
| 30 | Nevada | 426,000 | 31% | 131K |
| 31 | Kansas | 366,000 | 23% | 84K |
| 32 | Iowa | 364,000 | 17% | 60K |
| 33 | Arkansas | 354,000 | 18% | 63K |
| 34 | Connecticut | 345,000 | 24% | 83K |
| 35 | Mississippi | 295,000 | 22% | 65K |
| 36 | Idaho | 262,000 | 28% | 73K |
| 37 | Nebraska | 247,000 | 20% | 50K |
| 38 | New Mexico | 226,000 | 24% | 54K |
| 39 | West Virginia | 173,000 | 26% | 44K |
| 40 | Hawaii | 159,000 | 34% | 54K |
| 41 | Montana | 140,000 | 26% | 36K |
| 42 | New Hampshire | 138,000 | 35% | 49K |
| 43 | Maine | 135,000 | 27% | 36K |
| 44 | Rhode Island | 113,000 | 32% | 36K |
| 45 | South Dakota | 110,000 | 21% | 23K |
| 46 | North Dakota | 105,000 | 26% | 27K |
| 47 | Delaware | 104,000 | 33% | 35K |
| 48 | Alaska | 103,000 | 29% | 30K |
| 49 | Wyoming | 71,000 | 36% | 26K |
| 50 | Vermont | 71,000 | 35% | 25K |
North Carolina, Georgia, and Tennessee also saw high inbound movement, suggesting the Sun Belt remains a powerful draw due to job opportunities, climate, and affordability.
Coastal and Northern States See Modest Gains
California and New York still saw millions of total movers, but a smaller portion came from outside their borders—11% and 17%, respectively.
These high-population states often experience both significant inflows and outflows, as many residents leave for lower-cost regions while newcomers arrive for career opportunities or lifestyle reasons.
Small States Show High Mobility Rates
States like Wyoming, Vermont, and Hawaii had some of the highest percentages of newcomers from out of state, exceeding 30%.
Attractive natural environments, remote work flexibility, and lifestyle migration continue to reshape these regions.
Learn More on the Voronoi App 
If you enjoyed today’s post, check out Ranked: The Cities Americans Are Moving To on Voronoi, the new app from Visual Capitalist.