China Still Dominates Critical Mineral Refining in 2030
See visuals like this from many other data creators on our Voronoi app. Download it for free on iOS or Android and discover incredible data-driven charts from a variety of trusted sources.
Key Takeaways
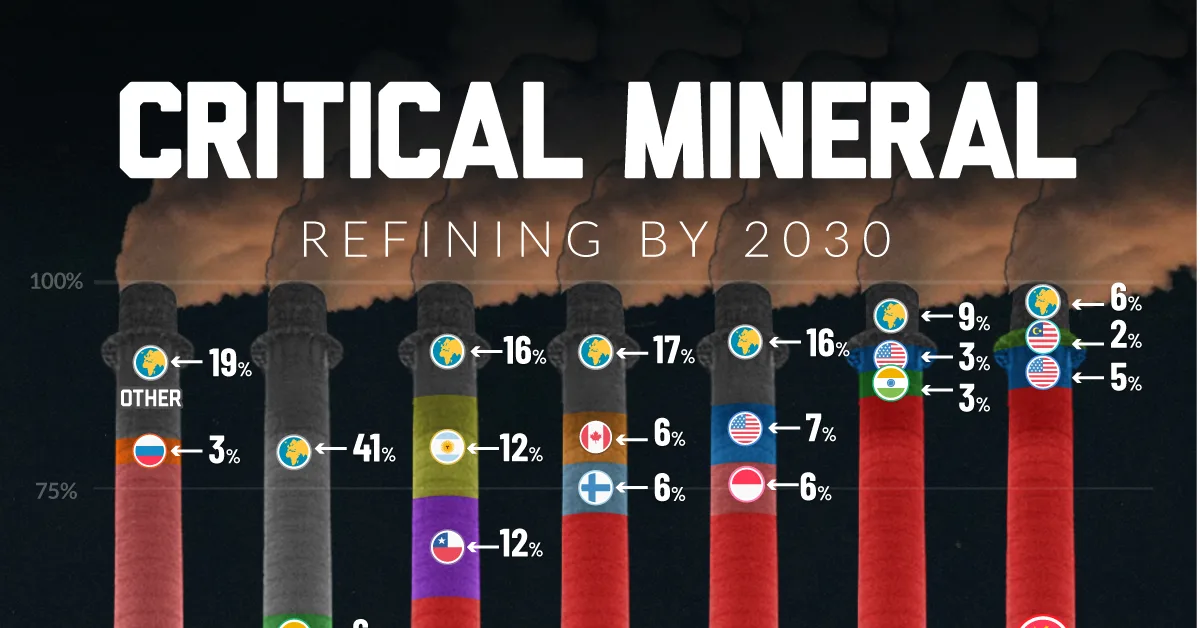
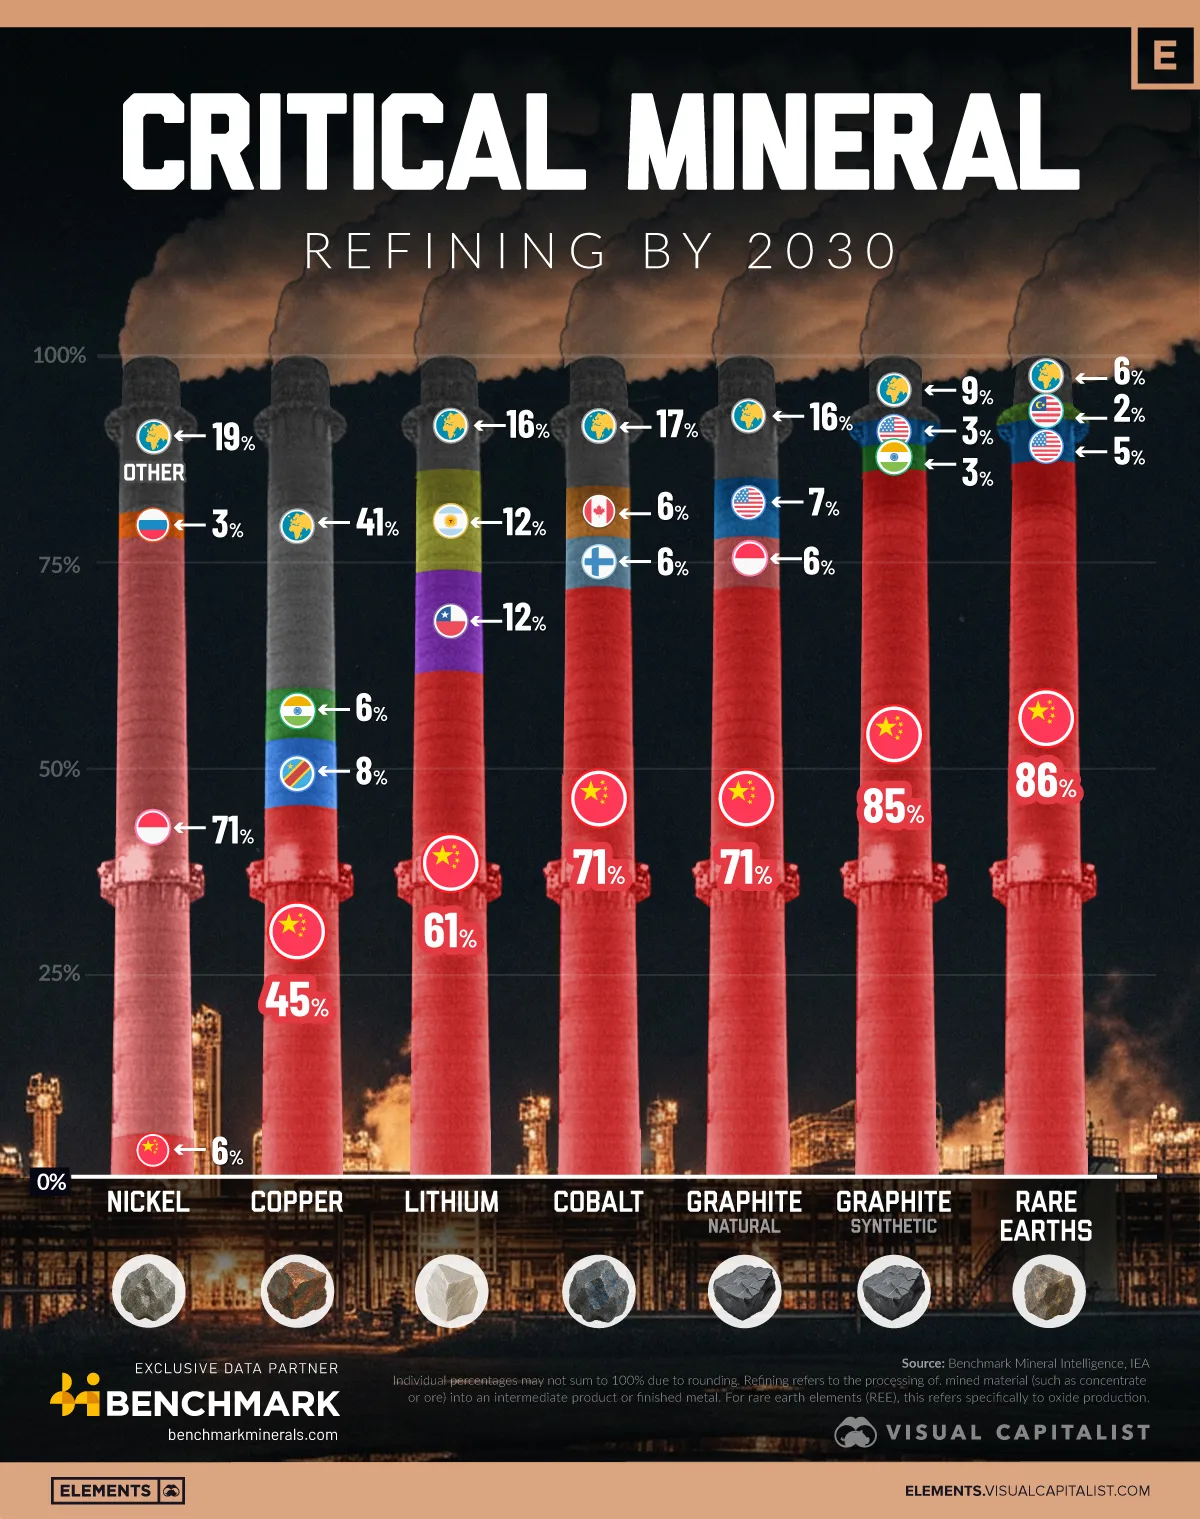
- China is projected to have the largest share (60%) of global refined critical mineral supply by 2030.
- Nickel is the only mineral which another country, Indonesia (71%), is expected to have a larger market share than China (6%).
The energy transition hinges on the availability of refined critical minerals. Where will they come from in the future?
This visualization shows the projected refining shares by 2030, based on data from Benchmark Mineral Intelligence and the International Energy Agency.
With one major exception, the data shows that one country will dominate future refining shares. China.
China to Dominate the Future of Critical Mineral Refining
By 2030, China will play a dominant role in lithium, rare earth elements (REEs), cobalt, and graphite, controlling nearly 60% of all critical mineral refining. Such concentrated processing capacity offers efficiencies that may lower costs but heightens geopolitical risk for downstream buyers.
It also leaves limited room for late-moving countries looking to gain share without major capital commitments.
| Country |  Nickel Nickel |
 Copper Copper |
 Lithium Lithium |
 REE REE |
 Cobalt Cobalt |
 Graphite (Synthetic) Graphite (Synthetic) |
 Graphite (Natural) Graphite (Natural) |
|---|---|---|---|---|---|---|---|
 China China |
6.24% | 44.63% | 60.86% | 86.11% | 71.42% | 85.16% | 70.50% |
 Indonesia Indonesia |
71.24% | — | — | — | — | — | 6.30% |
 Russia Russia |
3.26% | — | — | — | — | — | — |
 DRC DRC |
— | 7.96% | — | — | — | — | — |
 India India |
— | 6.41% | — | — | — | 3.06% | — |
 Chile Chile |
— | — | 11.59% | — | — | — | — |
 Argentina Argentina |
— | — | 11.58% | — | — | — | — |
 United States United States |
— | — | — | 5.14% | — | 2.79% | 7.22% |
 Malaysia Malaysia |
— | — | — | 2.27% | — | — | — |
 Finland Finland |
— | — | — | — | 5.87% | — | 0.69% |
 Canada Canada |
— | — | — | — | 5.73% | — | 4.47% |
 South Korea South Korea |
— | — | — | — | — | — | 3.56% |
 Australia Australia |
— | — | — | — | — | — | 2.01% |
 Sweden Sweden |
— | — | — | — | — | — | 1.84% |
 Morocco Morocco |
— | — | — | — | — | — | 1.15% |
 Saudi Arabia Saudi Arabia |
— | — | — | — | — | — | 0.94% |
 Uganda Uganda |
— | — | — | — | — | — | 0.72% |
 Tanzania Tanzania |
— | — | — | — | — | — | 0.58% |
 Other Other |
19.27% | 40.99% | 15.98% | 6.49% | 16.97% | 8.98% | — |
Nickel’s Outlier: Indonesia Leads, China Trails
Nickel is the one mineral where China is not on top. Indonesia will command over 71.24% of refined nickel by leveraging its large ore reserves, expanding low-cost refineries, and enforcing a ban on raw ore exports.
China’s share is just 6.24%, with Russia at 3.26% and the rest of the world spread across “Other” at 19.27%. This shift positions Indonesia as a price-setting force in nickel used for stainless steel or EV batteries.
Copper Is More Fragmented; North America Plays Niche Roles
Copper refining is relatively diversified. China holds 44.63%, but “Other” countries make up 40.99%, indicating broader global refining capacity.
The U.S. appears notably in rare earths (REEs) at 5.14%, while Finland and Canada register meaningful shares in cobalt at 5.87% and 5.73%, respectively.
These footholds can strengthen regional EV supply chains, but they still pale in comparison to China’s scale.
Learn More on the Voronoi App 
If you enjoyed this graphic, make sure to check out this graphic that shows how global coal consumption is still rising.