Charted: Global Grid Investment by Country (2020–2027F)
See visuals like this from many other data creators on our Voronoi app. Download it for free on iOS or Android and discover incredible data-driven charts from a variety of trusted sources.
Key Takeaways
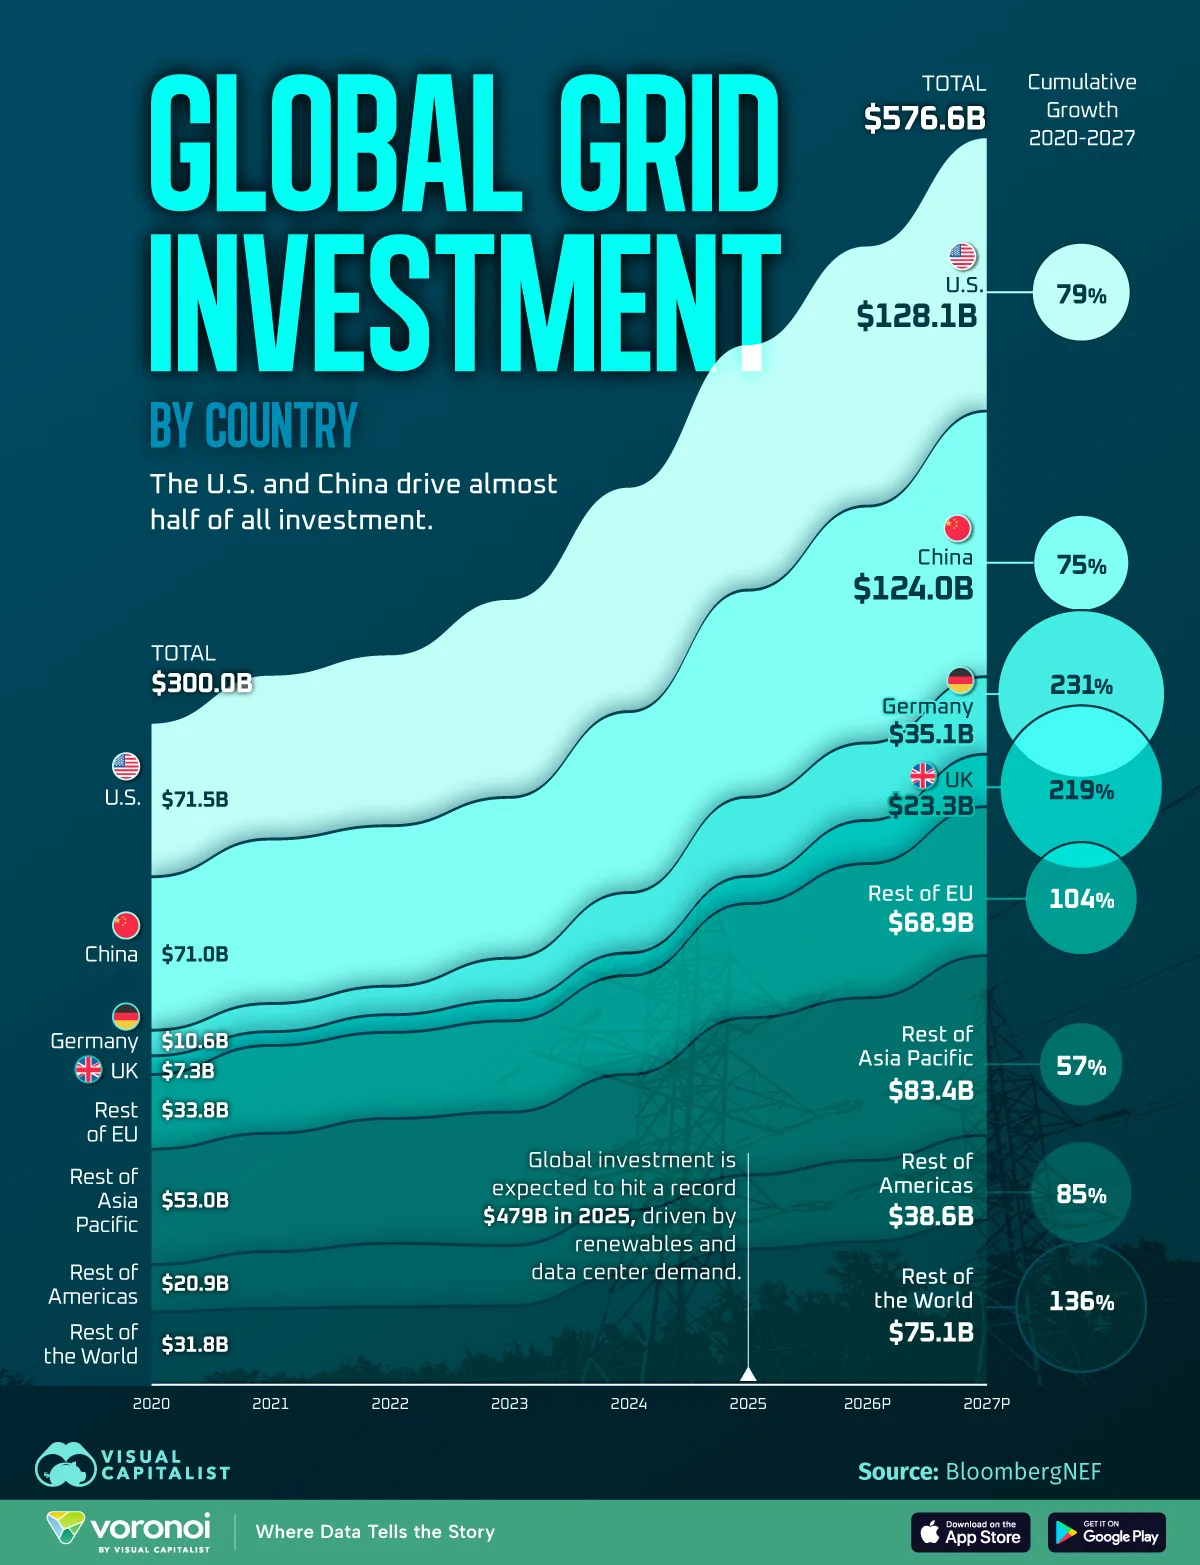
- Global grid investment is projected to nearly double from $300 billion in 2020 to $577 billion by 2027.
- The U.S. and China account for roughly half of all grid investment, reflecting their scale and electrification push.
Modern electricity grids sit at the center of the energy transition. As renewable generation expands and electricity demand rises, countries must invest heavily to modernize aging infrastructure, improve reliability, and handle more variable power sources.
This chart shows how grid investment is evolving across major countries and regions from 2020 through 2027, highlighting where capital is flowing and which markets are scaling up the fastest. The data for this visualization comes from BloombergNEF.
The U.S. and China Dominate Grid Spending
Overall, global grid investment rises from $300 billion in 2020 to an estimated $577 billion by 2027. Growth accelerated sharply after 2023, when annual spending begins posting double-digit increases as governments respond to grid bottlenecks, electrification, and renewable integration challenges.
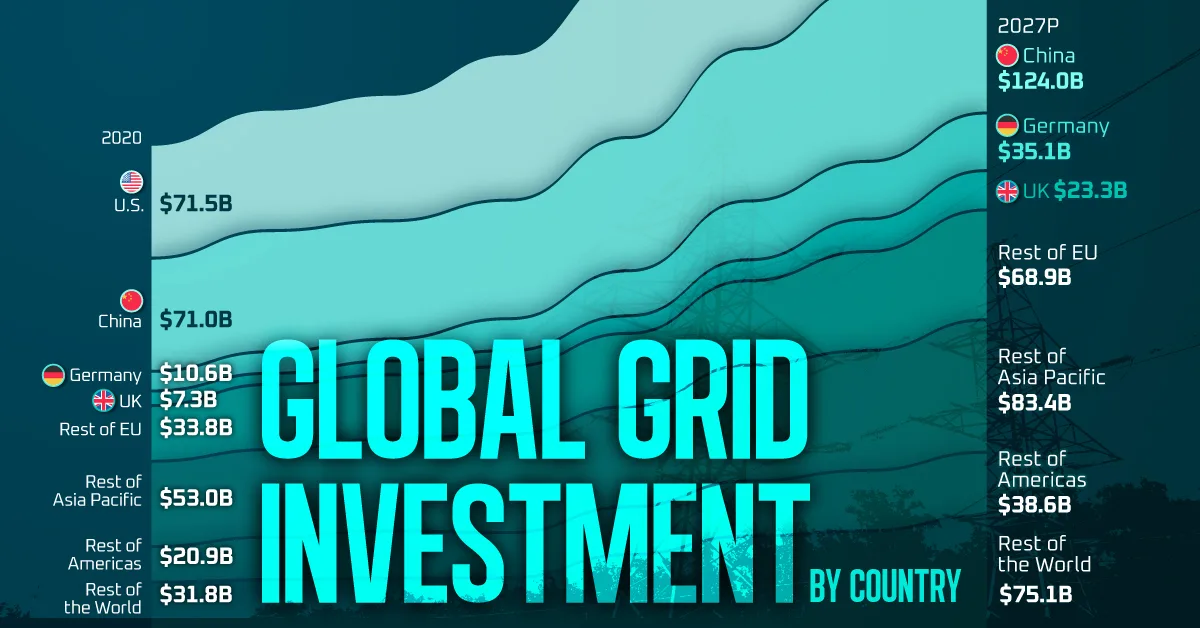
The U.S. and China are the two largest grid investors by a wide margin. U.S. spending climbs from $72 billion in 2020 to $128 billion by 2027. China follows a similar trajectory, rising from $71 billion in 2020 to $124 billion in 2027.
Together, these two markets drive roughly half of all global grid investment.
| Market/ Grid Investment | 2020 | 2021 | 2022 | 2023 | 2024 | 2025 | 2026F | 2027F |
|---|---|---|---|---|---|---|---|---|
 US US |
$72B | $76B | $80B | $93B | $105B | $115B | $122B | $128B |
 China China |
$71B | $76B | $74B | $75B | $84B | $96B | $110B | $124B |
 Germany Germany |
$11B | $12B | $12B | $19B | $27B | $36B | $35B | $35B |
 UK UK |
$7B | $5B | $7B | $8B | $9B | $11B | $19B | $23B |
 Rest of EU-27 Rest of EU-27 |
$34B | $40B | $39B | $42B | $45B | $52B | $62B | $69B |
 Rest of Asia Pacific Rest of Asia Pacific |
$53B | $54B | $58B | $62B | $63B | $73B | $75B | $83B |
 Rest of Europe, Middle East & Africa Rest of Europe, Middle East & Africa |
$32B | $34B | $34B | $35B | $50B | $62B | $65B | $75B |
 Rest of Americas Rest of Americas |
$21B | $25B | $28B | $27B | $29B | $33B | $37B | $39B |
 Total Total |
$300B | $323B | $332B | $358B | $411B | $479B | $525B | $577B |
Europe’s Push Accelerates After 2023
Europe shows strong growth, particularly in Germany, and the UK. Germany’s grid investment more than triples from $11 billion in 2020 to $35 billion by 2027, driven by renewable expansion and cross-border integration.
Across the rest of the EU-27, spending rises steadily to $69 billion by 2027.
Fast Growth in Emerging Regions
Some of the fastest growth occurs outside traditional power markets. Investment in the Rest of Asia Pacific climbs from $53 billion in 2020 to $83 billion in 2027, while spending across the Rest of Europe, the Middle East, and Africa jumps from $32 billion to $75 billion over the same period.
Learn More on the Voronoi App 
If you enjoyed today’s post, check out The Future of World Energy Supply (2024–2050), Charted on Voronoi, the new app from Visual Capitalist.