Global risk is entering a new phase. From Trump-era policy shifts and geopolitical tension to financial fraud, life sciences disruption, and record-breaking extreme weather, the landscape in 2025 is more volatile and interconnected than ever.
Throughout 2025, we partnered with Inigo to map these pressures across key themes, including politics, markets, and climate.
Below is a curated set of 10 visuals, grouped into five themes, with links to view each graphic in full, illustrating how data-driven storytelling can bring clarity to today’s risk landscape.
A New U.S. Administration

1. Ranked: Executive Orders by President in the First 100 Days
Executive orders signed in the first 100 days reveal how aggressively different presidents have used unilateral power, with Trump ranked at the top of the modern pack at 143 orders in his first 100 days of this term. Since then, he has brought his total to about 220 executive orders as of December 2025, far eclipsing recent presidents over a similar period.

2. Are Tariffs Causing U.S. Inflation Fears?
Inflation remains near 3% year-over-year, but proposed universal tariffs and higher levies on Chinese imports have reopened debate over whether trade policy could reignite price pressures.
Geopolitics
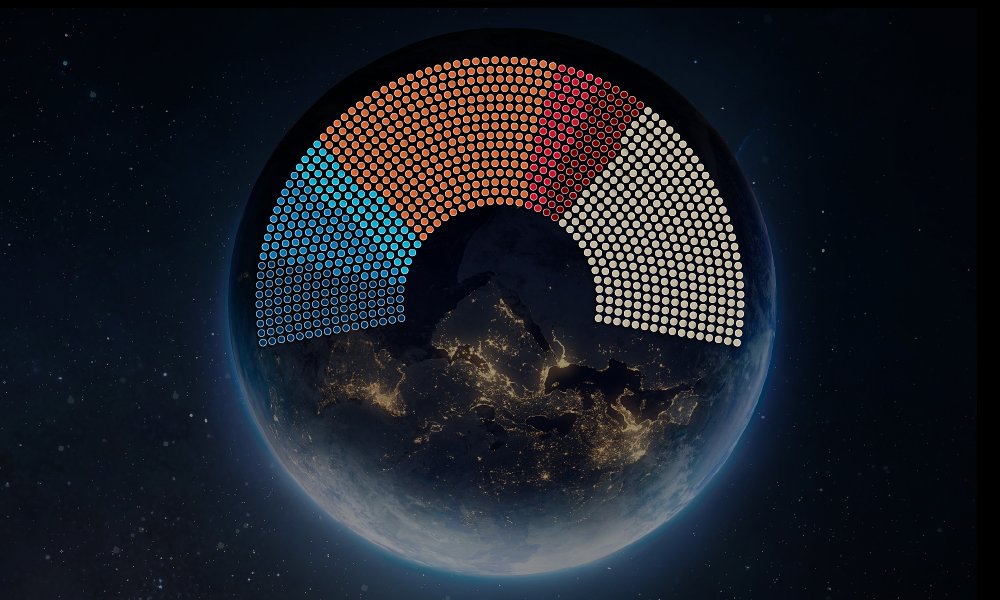
3. Which Types of Government Rule the World?
The global political map shows a patchwork of democracies, hybrid regimes, and authoritarian governments, with a large share of the world’s population living under non-democratic systems. This distribution shapes everything from policy predictability and the rule of law to sovereign-risk profiles.
4. Breaking Down the $524B Investment Needed to Rebuild Ukraine
Ukraine’s estimated reconstruction bill is spread across housing, transport, energy, industry, and agriculture, illustrating the breadth of damage from the war. The sector breakdown highlights that rebuilding will require decades of capital, coordination, and political risk management.
Fraud
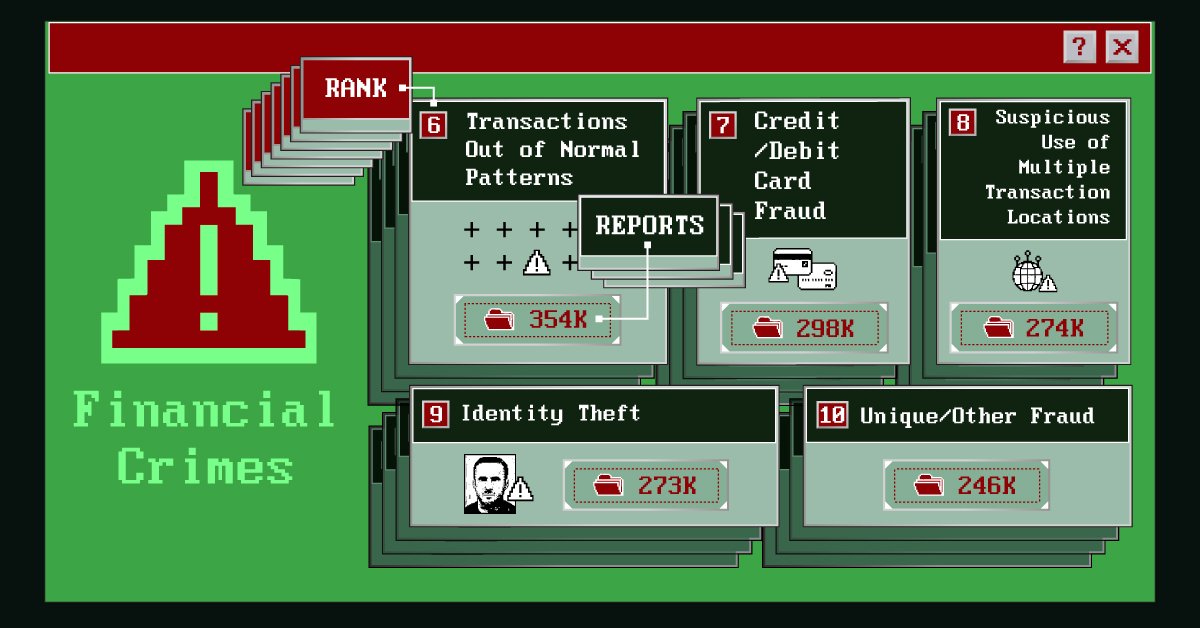
5. Ranked: America’s Most Common Financial Crimes
The most frequently reported financial crimes in the U.S.—from check fraud and purposeless transactions to suspicious transfers and identity theft—reveal where everyday vulnerabilities are most exposed. These patterns help risk teams focus controls and monitoring on the channels criminals exploit at scale.
6. The Fraud Trends Reshaping Risk in 2025
AI-powered scams, deepfakes, instant payments, and synthetic identities are among six trends pushing fraud into a new, more complex phase. The graphic shows how emerging technology is lowering the cost of sophisticated attacks and shifting liability across banks, platforms, and end users.
Extreme Weather
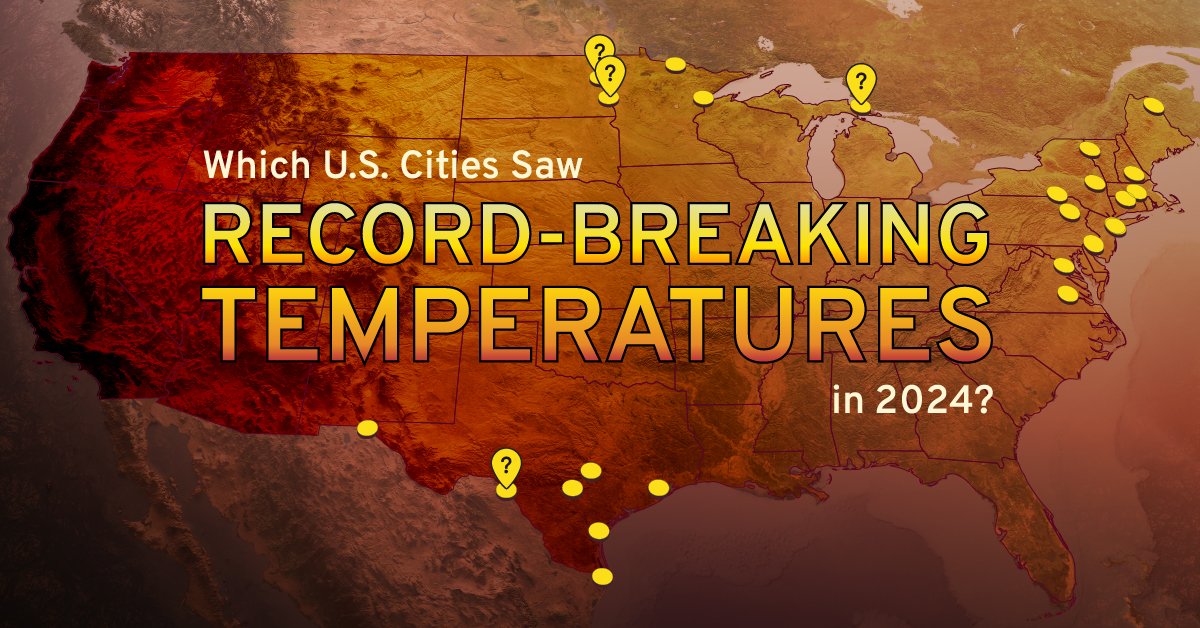
7. Which U.S. Cities Saw Record-Breaking Temperatures in 2024?
Record-breaking temperatures in 2024 popped up across a wide range of U.S. cities, not just traditional heat hotspots. The pattern underscores mounting stress on public health, infrastructure, and power grids as extreme heat becomes more frequent and widespread.
8. Ranked: The Most Expensive U.S. Wildfire Events, So Far
A relatively small number of mega-wildfires account for a disproportionate share of insured and economic losses in the United States. These outsized events raise hard questions about pricing, capacity, and long-term insurability at the wildland-urban interface.
Life Sciences
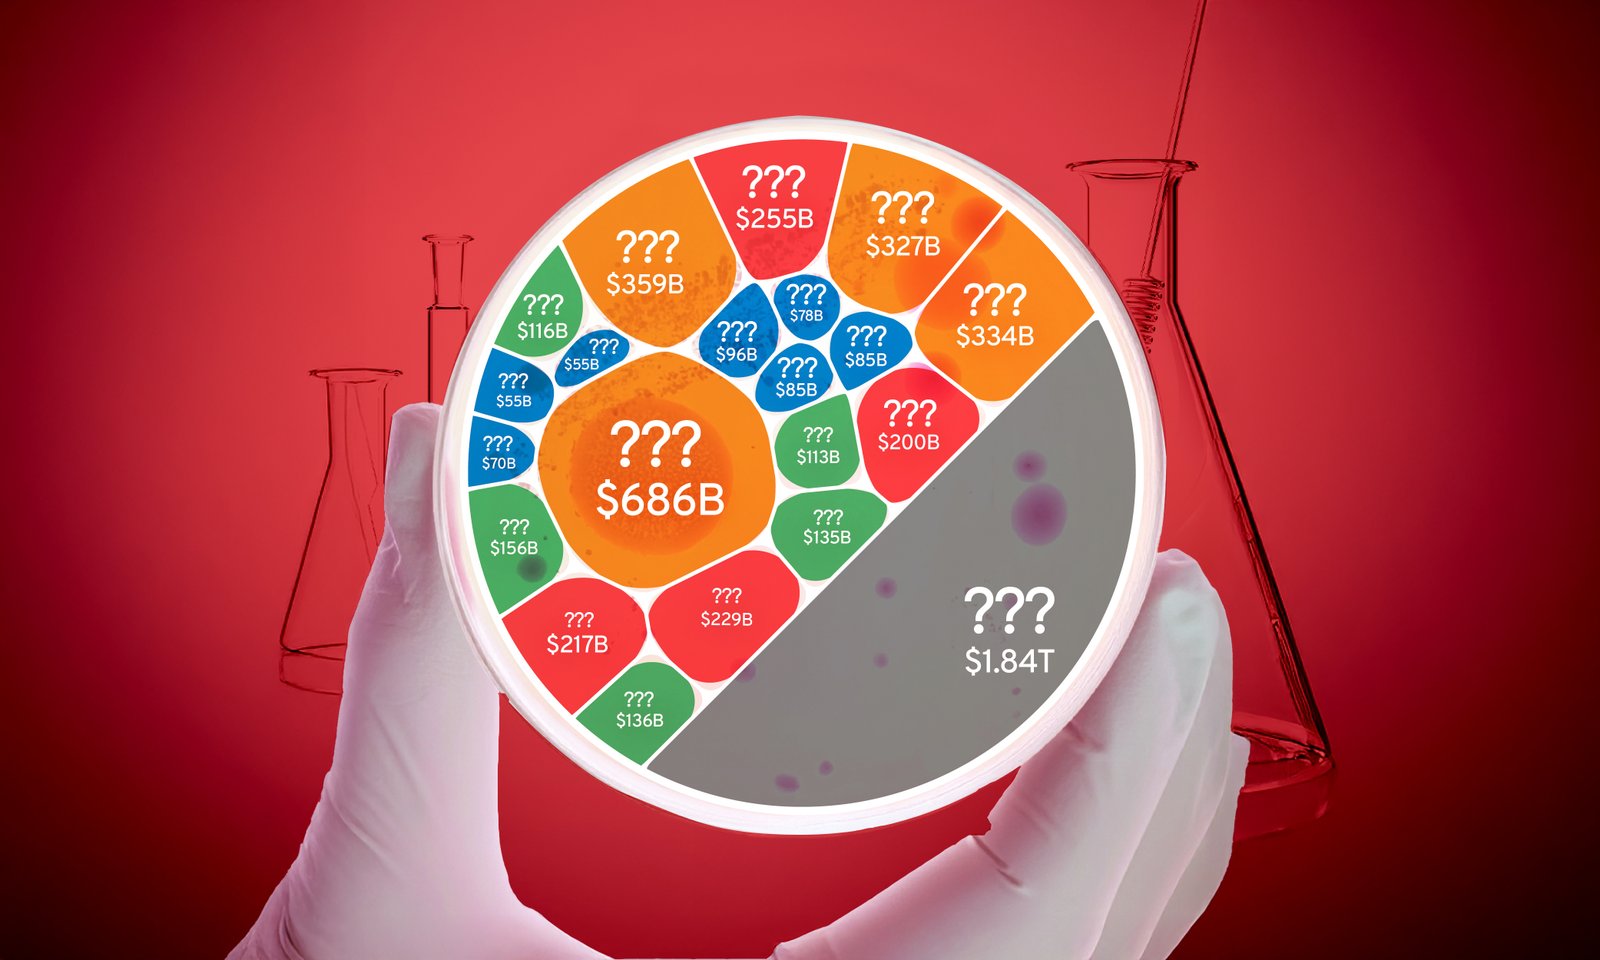
9. The $5.6T Pharmaceutical Industry in One Chart
Revenue across the roughly $5.6 trillion pharma ecosystem is heavily concentrated among a small group of global giants and blockbuster therapy areas. The landscape reflects how aging populations, chronic disease, and medical innovation are reshaping both growth prospects and risk exposures.
10. The $58B Weight Loss Drug Market in One Chart
GLP-1s and related treatments have rapidly built a $58 billion weight-loss drug market, transforming expectations around obesity and metabolic disease. The surge in demand hints at far-reaching implications for healthcare costs, longevity, food and beverage demand, and life & health insurance.
Looking Ahead: Building the Future Grid
From Trump-era policy shifts and geopolitical shocks to fraud, pharma breakthroughs, and extreme weather, today’s threats are deeply interconnected. Navigating them demands smarter data, flexible capital, and a holistic view of how risk propagates across systems.
From geopolitical shocks to climate extremes, Inigo helps turn uncertainty into clarity.


