
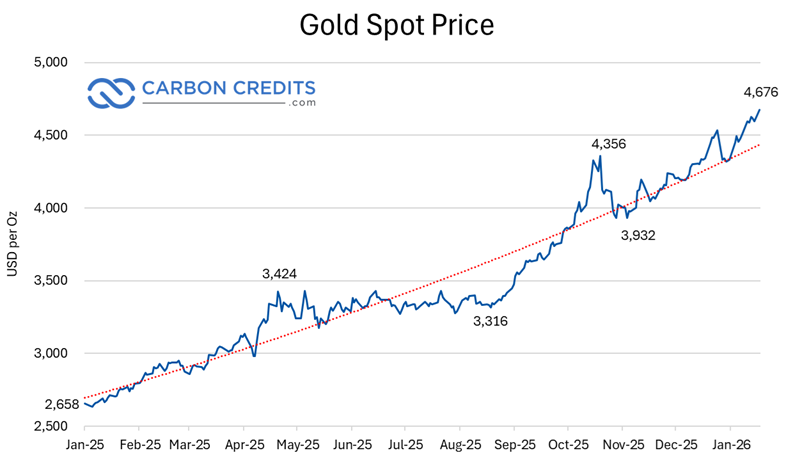
Gold prices have climbed to historic levels in global markets, with Bloomberg reporting that spot gold hit an intraday all‑time high of 4,689.15 dollars per ounce on January 19, 2026. This milestone underscores intense safe‑haven demand as investors navigate ongoing macroeconomic uncertainty and shifting expectations for future interest‑rate cuts.
Gold’s latest surge extends a powerful bull run. In 2025, the metal posted more than 50 new record highs and delivered a yearly return of over 60 percent, drawing in institutional investors, central banks, and retail traders seeking diversification and protection against market volatility.
Over the past two years, gold prices have roughly doubled, a rare feat for a major, highly liquid commodity, reinforcing its status as a store of value and hedge against inflation and geopolitical risk.
Why Investors Flock to Gold: Safe Haven and Policy Signals
A key driver of the gold rally is shifting expectations around monetary policy, especially in the United States. Many investors now expect the Federal Reserve to cut interest rates in 2026.
When interest rates fall, gold becomes more attractive because it does not pay interest or dividends. This lowers the opportunity cost of holding gold compared with bonds or savings.
The U.S. dollar has also shown signs of weakening against other major currencies at times, another factor that boosts gold demand. A weaker dollar makes gold cheaper for holders of non‑U.S. currencies, increasing global buying pressure.
During periods of market stress and geopolitical tension, investors often treat gold as a safe haven. These conditions have become more common in late 2025 and early 2026, driving flows into gold‑related investments.
Central Banks: The Steady Hands Behind Gold’s Rally
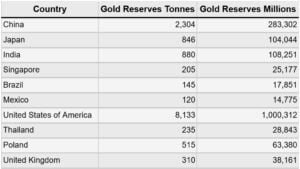
Central banks have played an unusually large role in supporting gold prices. According to World Gold Council data, global central banks added 1,044.6 metric tons of gold to reserves in 2024. This was the third year in a row that purchases exceeded 1,000 tons. This amount is much higher than the long-term average of about 473 tons from 2010 to 2021.
Gold as a percentage of total reserve holdings across select central banks

The trend continued into 2025, with central banks acquiring substantial amounts through the third quarter. Net quarterly demand from investors and central banks hit about 980 tons. This equals roughly $109 billion in gold inflows for Q3 2025.
Major buyers include emerging market central banks such as Poland, China, India, and Turkey, each adding significant quantities to their reserves. These purchases help reduce reliance on foreign currencies and support financial diversification strategies.
Strong central bank buying has limited the amount of gold available on the markets for other buyers. Because these purchases tend to be long‑term and price‑insensitive, they act as a stable base of demand, supporting higher price levels.
Supply Tightness Keeps Prices Elevated
Gold supply has struggled to keep pace with rising demand. Mining production reached a record 3,661 metric tons in 2024, a modest increase of 0.6% year‑over‑year.
Production gains happened in Mexico, Canada, and Ghana. However, rising costs have offset some of this growth. Overall cost to produce gold, measured as all‑in sustaining cost (AISC), rose to about $1,399 per ounce in 2024, up roughly 8% from the prior year.
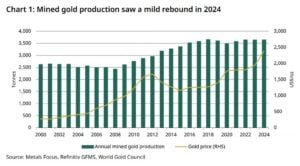
Recycling and secondary supply help the market, but they have limits. These sources haven’t eased market tightness much. The combination of constrained supply and strong demand keeps pressure on prices.
Global Ripple Effects: From Central Banks to Exploration
Rising gold prices have real economic and financial impacts. In the Philippines, for instance, the Bangko Sentral ng Pilipinas noted that its gold holdings jumped about 70% in 2025. They reached a record $18.6 billion. This rise was mainly due to a big increase in gold prices. Gold now makes up about 17% of the central bank’s foreign exchange reserves.
Around the world, strong gold prices have influenced central bank profits and balance sheets. The Swiss National Bank reported one of its highest profit levels in history in 2025, driven in part by gains on its gold holdings as prices rallied.
High prices have also affected exploration activity. Australia’s gold exploration spending jumped about 34% year-over-year in Q2 2025. This rise shows growing interest in new projects as prices have gone up.
- SEE MORE: Gold Price Today Surges to All-Time High at $3,671 as Miners Push ESG and Carbon Reduction Goals
What This Means for Investors and Markets
The current rise in gold prices shows a mix of economic risks, expectations about monetary policy, and high demand from official sectors. These forces suggest that gold’s role as a defensive asset remains important in the current environment.
While gold does not produce income, it continues to attract buyers seeking stability and diversification. Central banks are accumulating gold. This, along with strong investor demand and limited supply, pushes prices up.
Analyst forecasts suggest that gold may remain elevated in the coming year if these conditions persist. Some forecasts suggest gold might average around $4,753 per ounce until 2026, per J.P. Morgan’s forecast. It could rise more in 2027 if global economic stress grows.

In this context, gold’s rise is not just a short‑term spike. It highlights key changes in how investors, banks, and governments deal with uncertainty and risk. As these trends evolve, gold is likely to remain a key asset in global financial markets.
Beyond market forces and central bank demand, the gold industry is also under pressure to reduce its environmental impact and align with global climate goals.
Gold Goes Green: Mining’s Climate and Net-Zero Push
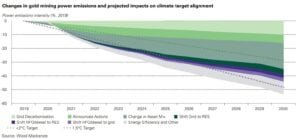
Gold mining produces greenhouse gas emissions, mostly from fuel and electricity used in mining and processing. In 2023, primary gold mines around the world released about 46.6 million metric tons of CO₂ equivalent (CO₂e) from direct (Scope 1) and electricity (Scope 2) emissions. This number reflects the energy‑intensive nature of mining operations.
Leading gold producers have set clear climate targets to reduce emissions and improve sustainability. For example, Barrick Gold aims to cut its own operational Scope 1 and Scope 2 emissions by at least 30% by 2030 from a 2018 baseline. It also plans to reach net‑zero emissions by 2050 as part of its long‑term climate strategy. The company is investing in big solar power plants to reduce the use of fossil fuels. One of these is a 200 MW solar farm for the Nevada Gold Mines complex.
Newmont Corporation, a leading gold producer, also plans to cut greenhouse gas emissions by 30% by 2030. They also aim for net-zero carbon emissions by 2050. The company is shifting its energy mix and investing in cleaner technologies to meet these goals.
Gold Fields has committed to cutting its Scope 1 and Scope 2 emissions by 30% by 2030 from a 2016 baseline and to reach net‑zero emissions by 2050. In 2023, the company reduced its emissions intensity to 660 kg CO₂e per ounce of gold, compared with 669 kg CO₂e per ounce in 2022. It plans further cuts through increased use of renewables, energy efficiency, and lower‑carbon mine equipment.
- MUST READ: Gold’s Enduring Value: How Sierra Madre Is Advancing Mexico’s Next Generation of Gold Projects
Renewables Powering Gold Production
Some producers are already deploying renewable energy at scale. For example, Barrick’s Nevada operations have reduced electricity‑related emissions by investing in solar power and renewable energy credits.
Other mines are testing battery-electric haul trucks. They’re also using renewable microgrids and off-grid solar and wind sites. This helps cut diesel use and lower carbon output.
These company commitments show that gold mining firms are integrating emissions reduction into their business plans. Many have set 2030 interim goals to lower emissions, and most aim for net‑zero emissions by 2050, in line with global climate targets.
Gold’s recent price rise shows global economic uncertainty. It also reflects strong demand from investors and central banks. At the same time, the industry is taking meaningful steps to reduce emissions and advance sustainability. This shows that gold can be both a safe investment and a cleaner, more responsible choice.
The post Gold Prices Smash Another Record: Spot Gold Hits $4,689 All‑Time High as Central Banks Go on a Buying Spree appeared first on Carbon Credits.


