Mapped: How Currency Performance Shifted by Region in 2025
Economic health, trade dynamics, and financial stability (among other factors) remain critical determinants of currency performance.
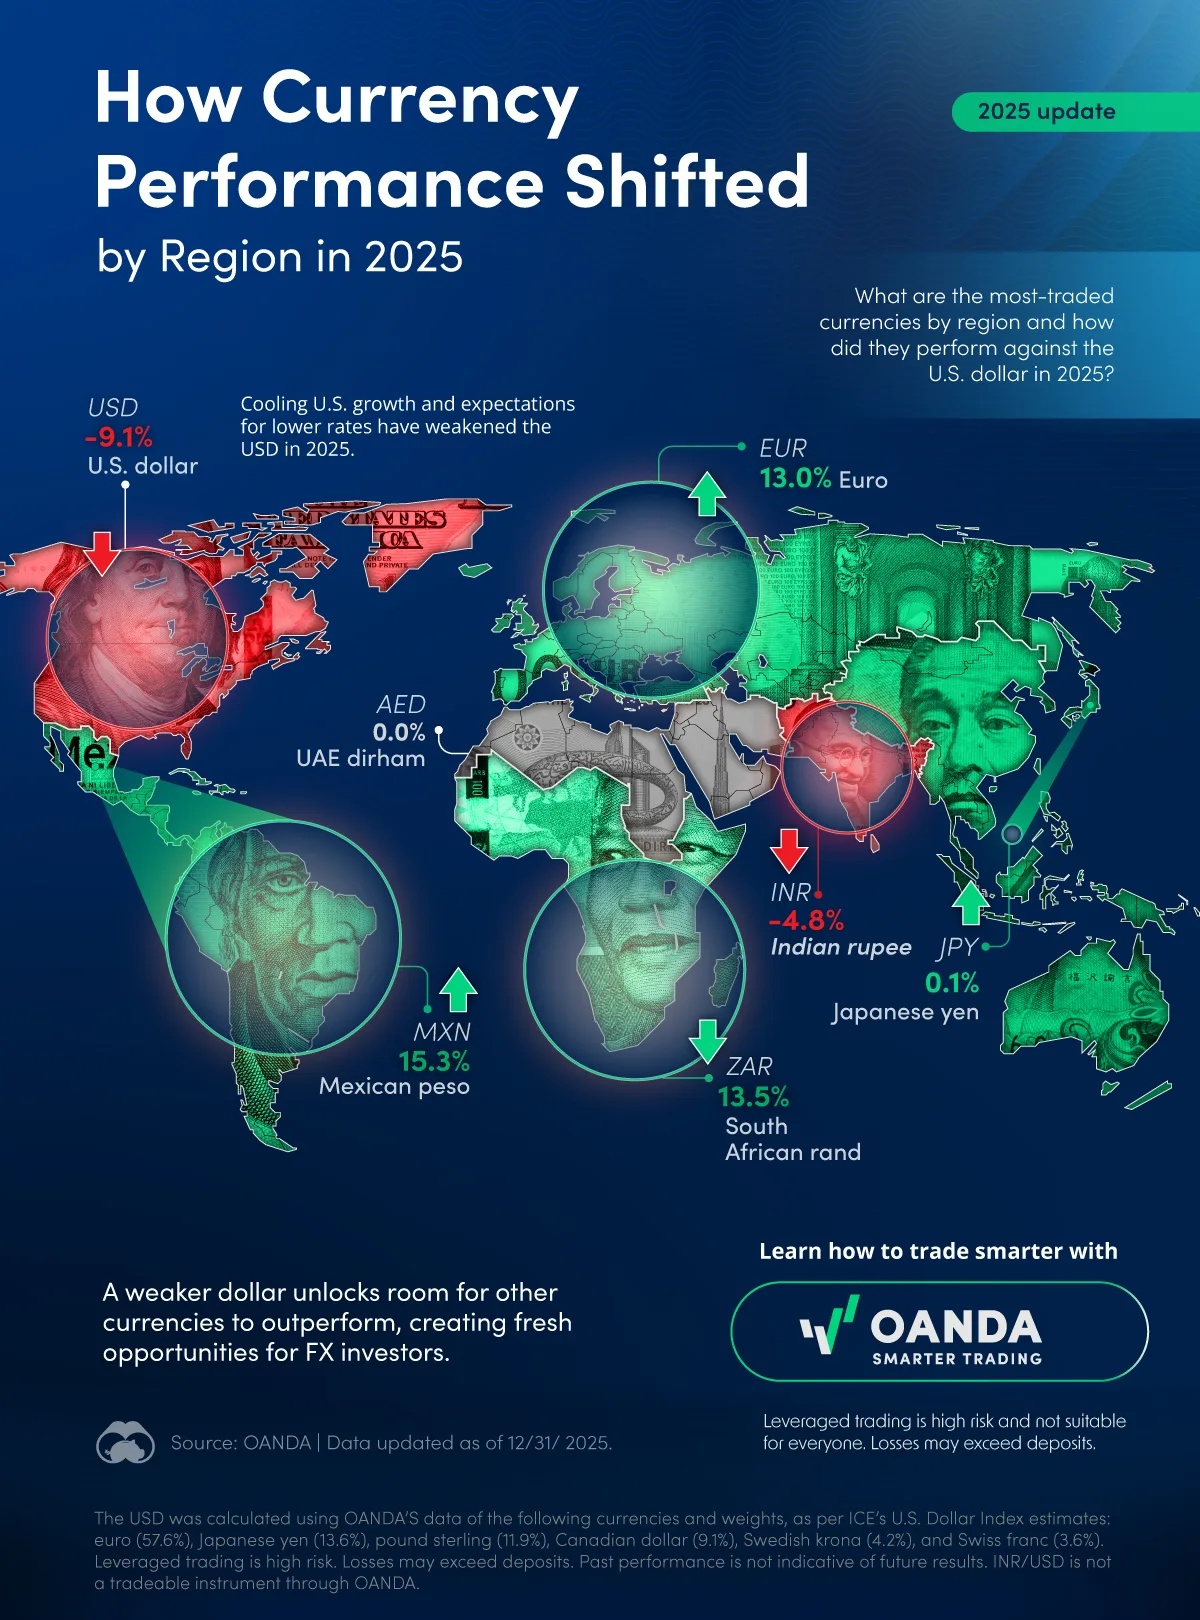
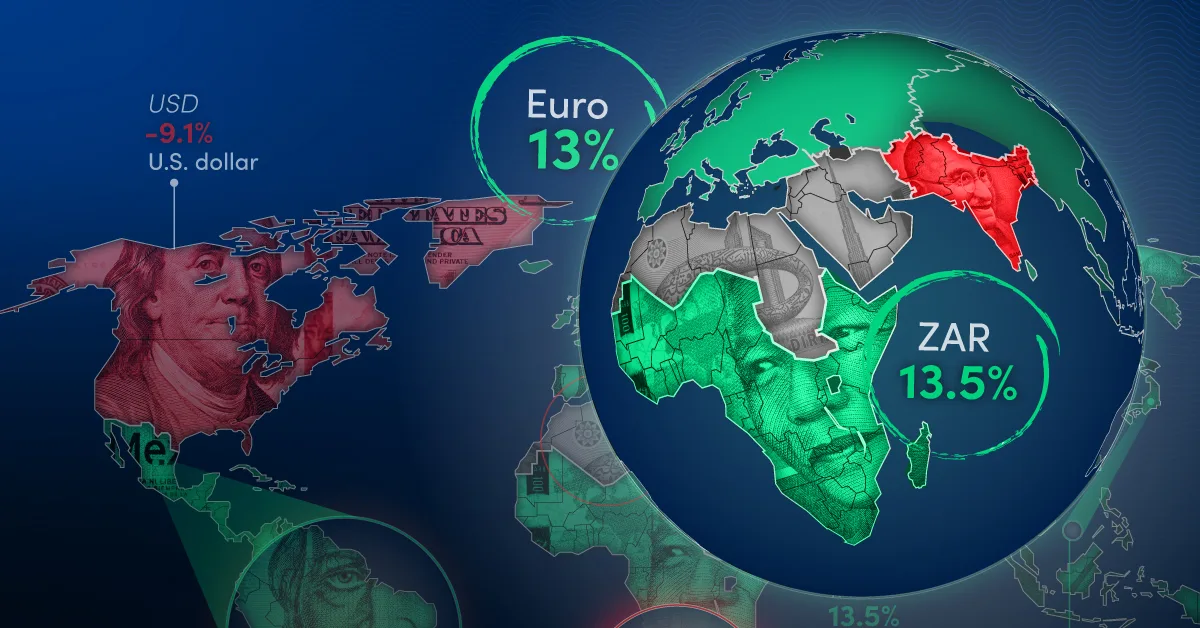
This graphic, created in partnership with OANDA, illustrates the 2025 performance of the most-traded currencies by region, offering an overall health check on some of the world’s most influential currencies.
What Are the Most-Traded Currencies by Region?
The most-traded currency across North America, and the world, is the U.S. dollar (USD). According to the BIS, the USD has an average daily trading volume of $8.56 trillion.
In Europe, the euro (EUR) takes the top spot, with an average daily trading volume of $2.77 trillion.
Other leading regional currencies include the Japanese yen (East Asia & Pacific), Mexican peso (Latin America & Caribbean), Indian rupee (South Asia), UAE dirham (Middle East & North Africa), and South African rand (Sub-Saharan Africa).
Which Currencies Gained Ground in 2025?
After a challenging prior year, most major currencies rebounded in 2025, posting gains against the U.S. dollar.
The strongest performers were the Mexican peso, which surged 15.3%, and the South African rand, up 13.5%. The euro also staged a notable comeback, climbing 13.0% as easing inflation pressures and improving growth expectations supported the currency.
| Region | Currency | 2025 (% change) |
|---|---|---|
| North America | U.S. dollar (USD) | -9.1% |
| Middle East & North Africa | UAE dirham (AED) | 0.0% |
| South Asia | Indian rupee (INR) | -4.8% |
| Sub-Saharan Africa | South African rand (ZAR) | 13.5% |
| Europe & Central Asia | Euro (EUR) | 13.0% |
| East Asia & Pacific | Japanese yen (JPY) | 0.1% |
| Latin America & Caribbean | Mexican peso (MXN) | 15.3% |
Meanwhile, the Japanese yen finished the year essentially flat, gaining 0.1%, reflecting continued monetary policy divergence with the U.S.
Which Currencies Lost Ground in 2025?
In contrast to broad global gains, the U.S. dollar weakened sharply in 2025, falling 9.1% as slowing economic momentum and shifting interest rate expectations weighed on the currency.
The Indian rupee also declined, slipping 4.8% against the USD amid persistent structural challenges and capital flow pressures. The UAE dirham, which remains pegged to the U.S. dollar, finished the year flat, mirroring USD performance.
Opportunities in Foreign Exchange Trading
The reversal in currency performance highlights how quickly conditions can change in global FX markets. As capital rotated away from the U.S. dollar in 2025, several previously underperforming currencies staged strong recoveries.
For investors looking ahead, opportunities may emerge in tracking relative economic momentum, central bank policy shifts, and commodity-linked currencies. This is particularly the case in regions that showed resilience or renewed strength over the year.
OANDA can help you trade smarter with a wide range of global currencies, including the USD.
Note: Past performance is not indicative of future results.
-

 Markets6 days ago
How the Gold Rally Is Playing Out Around the World
Gold’s breakout in 2025 is compelling when viewed across global currencies. Which ones are rising the fastest?
-
 Markets2 weeks ago
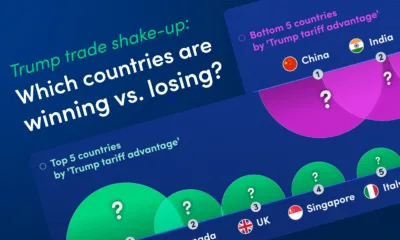
Trump Trade Shake-Up: Which Countries Are Winning Vs. Losing?
As U.S. trade policy shifts under President Trump, global exporters are facing a more uneven landscape. Which ones are winning versus losing?
-

 Markets2 weeks ago
What Happens to the USD When the Fed Cuts Rates?
Will Fed easing in 2026 pressure the USD, or will global rate shifts rewrite the usual pattern?
-
 Money1 year ago
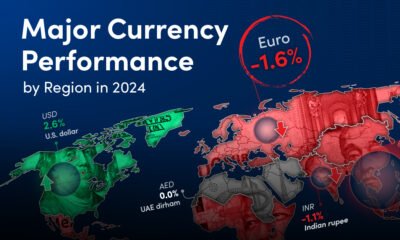
Major Currency Performance by Region in 2024
For each of the world’s seven major regions, what is the most-traded currency and how did it perform versus the U.S. dollar in 2024?
-
 Money1 year ago
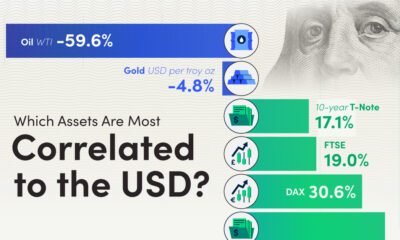
Which Assets Are Most Correlated to the USD?
Building a well-balanced, diversified portfolio involves including assets with varying correlations. The USD, with its weak or negative correlations to other assets, can be a valuable…
-

 Markets1 year ago
Ranked: The Ten Most Traded Currencies with the U.S. Dollar
The U.S. dollar is used in 88% of FX trading transactions. Which currencies are most commonly on the other side of the exchange?
-
 Markets2 years ago
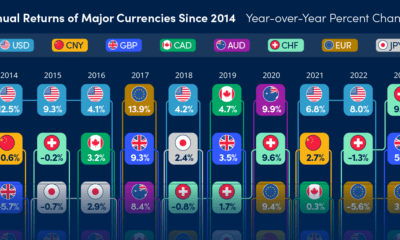
Ranked: The Top Performing Major Currencies (2014-2023)
Which major currencies have performed best on the foreign exchange market over the last decade?
- Source: https://www.visualcapitalist.com/sp/mapped-how-currency-performance-shifted-by-region-in-2025/


var disqus_shortname = “visualcapitalist.disqus.com”;
var disqus_title = “Mapped: How Currency Performance Shifted by Region in 2025”;
var disqus_url = “https://www.visualcapitalist.com/sp/mapped-how-currency-performance-shifted-by-region-in-2025/”;
var disqus_identifier = “visualcapitalist.disqus.com-194518”;