Who’s Powering Global Economic Growth in 2026?
See visuals like this from many other data creators on our Voronoi app. Download it for free on iOS or Android and discover incredible data-driven charts from a variety of trusted sources.
Key Takeaways
- Global real GDP growth is forecast to reach 3.1% in 2026.
- China and India together account for 43.6% of global real GDP growth in 2026.
- Asia-Pacific contributes nearly 60% of total global GDP growth.
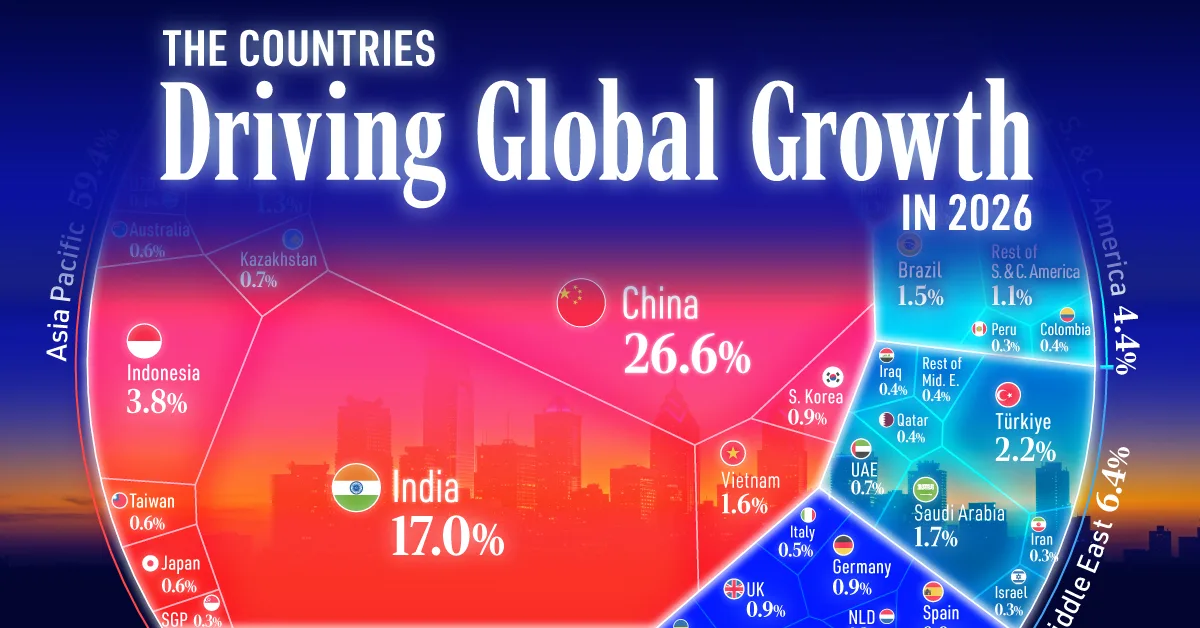
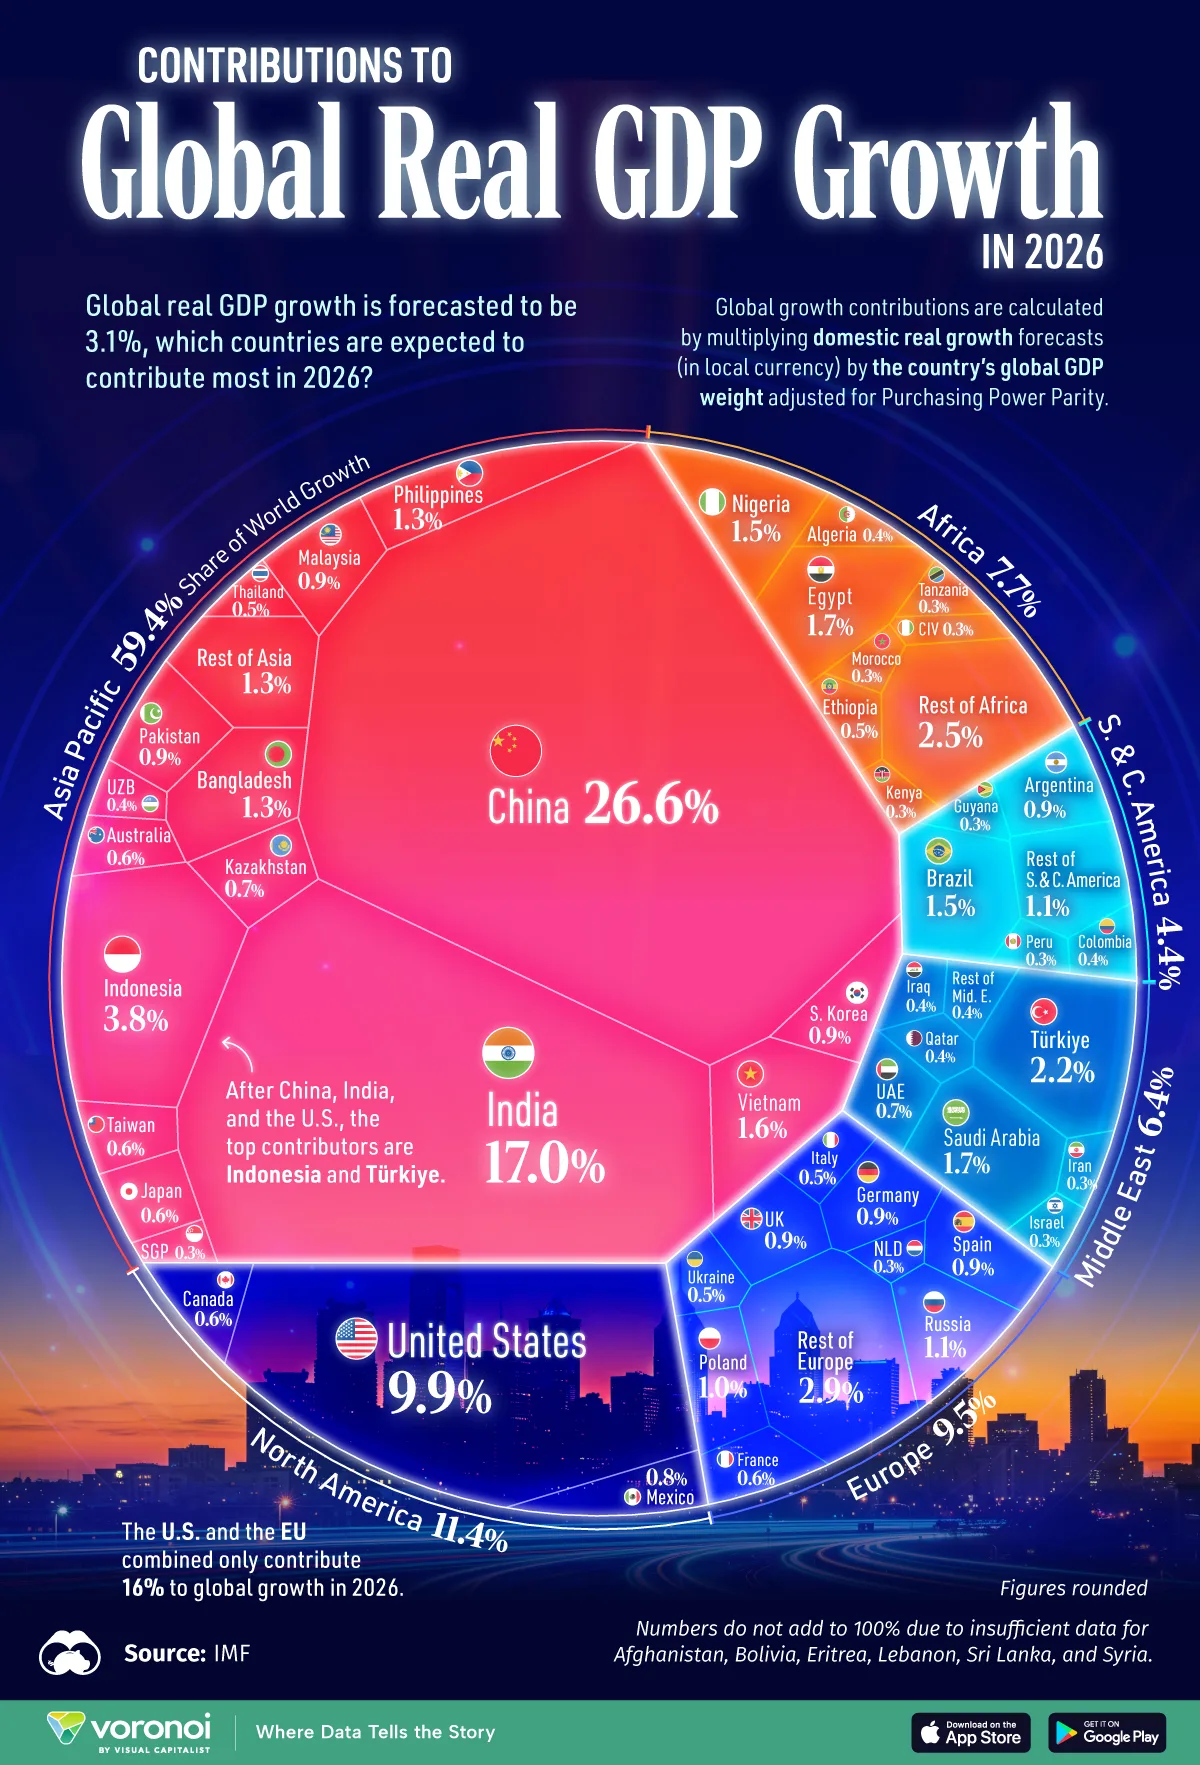
Global economic growth is expected to remain resilient in 2026, with real GDP projected to grow by 3.1%, even as advanced economies slow and emerging markets play a larger role.
This visualization breaks down each country and region’s share of global real GDP growth in 2026, based on forecast data from the International Monetary Fund (IMF).
 Note on methodology: The IMF calculates contributions to global real GDP growth using purchasing power parity (PPP) GDP, which adjusts for local price differences, allowing faster-growing emerging economies to have a more representative impact on global growth.
China and India Drive Global GDP Growth in 2026
China is forecast to contribute 26.6% of global real GDP growth in 2026, by far the largest share of any country.
Despite slower headline growth rates compared to previous decades, China’s sheer economic size still makes it the single biggest driver of global expansion.
Here’s a look at each country’s contribution to global real GDP growth in 2026:
| Rank | Country | 2025 Real GDP (PPP, billions) | 2026 Real GDP Growth | Share of 2026 Global Real GDP Growth |
|---|---|---|---|---|
| 1 |  China China |
$41,015.8 | 4.2% | 26.6% |
| 2 |  India India |
$17,714.2 | 6.2% | 17.0% |
| 3 |  United States United States |
$30,615.7 | 2.1% | 9.9% |
| 4 |  Indonesia Indonesia |
$5,015.8 | 4.9% | 3.8% |
| 5 |  Türkiye Türkiye |
$3,766.8 | 3.7% | 2.2% |
| 6 |  Saudi Arabia Saudi Arabia |
$2,688.5 | 4.0% | 1.7% |
| 7 |  Egypt Egypt |
$2,381.5 | 4.5% | 1.7% |
| 8 |  Vietnam Vietnam |
$1,807.1 | 5.6% | 1.6% |
| 9 |  Brazil Brazil |
$4,973.4 | 1.9% | 1.5% |
| 10 |  Nigeria Nigeria |
$2,254.2 | 4.2% | 1.5% |
| 11 |  Bangladesh Bangladesh |
$1,782.1 | 4.9% | 1.3% |
| 12 |  Philippines Philippines |
$1,477.7 | 5.7% | 1.3% |
| 13 |  Russian Federation Russian Federation |
$7,143.1 | 1.0% | 1.1% |
| 14 |  Poland Poland |
$2,019.8 | 3.1% | 1.0% |
| 15 |  Germany Germany |
$6,153.7 | 0.9% | 0.9% |
| 16 |  United Kingdom United Kingdom |
$4,454.7 | 1.3% | 0.9% |
| 17 |  Pakistan Pakistan |
$1,671.4 | 3.6% | 0.9% |
| 18 |  Malaysia Malaysia |
$1,478.1 | 4.0% | 0.9% |
| 19 |  Argentina Argentina |
$1,490.2 | 4.0% | 0.9% |
| 20 |  Spain Spain |
$2,828.5 | 2.0% | 0.9% |
| 21 |  Republic of Korea Republic of Korea |
$3,363.4 | 1.8% | 0.9% |
| 22 |  Mexico Mexico |
$3,436.9 | 1.5% | 0.8% |
| 23 |  Kazakhstan Kazakhstan |
$912.6 | 4.8% | 0.7% |
| 24 |  United Arab Emirates United Arab Emirates |
$935.5 | 5.0% | 0.7% |
| 25 |  Japan Japan |
$6,758.2 | 0.6% | 0.6% |
| 26 |  France France |
$4,533.6 | 0.9% | 0.6% |
| 27 |  Canada Canada |
$2,722.8 | 1.5% | 0.6% |
| 28 |  Taiwan Taiwan |
$1,990.3 | 2.1% | 0.6% |
| 29 |  Australia Australia |
$1,981.7 | 2.1% | 0.6% |
| 30 |  Italy Italy |
$3,720.3 | 0.8% | 0.5% |
| 31 |  Thailand Thailand |
$1,853.8 | 1.6% | 0.5% |
| 32 |  Ukraine Ukraine |
$686.9 | 4.5% | 0.5% |
| 33 |  Ethiopia Ethiopia |
$486.8 | 7.1% | 0.5% |
| 34 |  Algeria Algeria |
$874.6 | 2.9% | 0.4% |
| 35 |  Iraq Iraq |
$700.6 | 3.6% | 0.4% |
| 36 |  Qatar Qatar |
$380.2 | 6.1% | 0.4% |
| 37 |  Uzbekistan Uzbekistan |
$473.5 | 6.0% | 0.4% |
| 38 |  Colombia Colombia |
$1,189.5 | 2.3% | 0.4% |
| 39 |  Iran Iran |
$1,878.9 | 1.1% | 0.3% |
| 40 |  Netherlands Netherlands |
$1,516.7 | 1.2% | 0.3% |
| 41 |  Singapore Singapore |
$953.9 | 1.8% | 0.3% |
| 42 |  Israel Israel |
$567.6 | 3.9% | 0.3% |
| 43 |  Morocco Morocco |
$431.3 | 4.2% | 0.3% |
| 44 |  Kenya Kenya |
$403.2 | 4.9% | 0.3% |
| 45 |  Tanzania Tanzania |
$293.6 | 6.3% | 0.3% |
| 46 |  Côte d’Ivoire Côte d’Ivoire |
$266.9 | 6.4% | 0.3% |
| 47 |  Guyana Guyana |
$75.2 | 23.0% | 0.3% |
| 48 |  Peru Peru |
$653.1 | 2.7% | 0.3% |
| – |  Other Europe Other Europe |
$10,816.9 | – | 2.9% |
| – | Other Africa |
$4,219.5 | – | 2.5% |
| – |  Other Asia Other Asia |
$2,702.6 | – | 1.3% |
| – |  Other Americas Other Americas |
$3,097.3 | – | 1.1% |
| – | Other Middle East |
$816.3 | – | 0.4% |
India follows as the second-largest contributor, accounting for 17% of global growth. Together, China and India are expected to generate more than 43% of global real GDP growth in 2026.
Among advanced economies, the U.S. is projected to contribute 9.9% of global growth, making it the largest contributor across all developed nations.
Europe’s contribution stands at 9.5% of global growth, spread across Germany, France, Italy, Spain, and other economies. Slower population growth, aging demographics, and tighter financial conditions continue to weigh on the region’s economic expansion.
When combined, the U.S. and the EU together account for just 16% of total global growth, with the center of economic momentum shifting toward emerging markets.
A Shifting Global Growth Landscape
From a regional perspective, the Asia-Pacific region dominates global growth with a 59.4% share, with Indonesia, Vietnam, and other economies playing a significant role alongside China and India.
North America contributes 11.4%, followed by Europe. Africa, which hosts most of the world’s fastest-growing economies, accounts for 7.7% of global growth, led by Nigeria, Egypt, and Ethiopia.
Overall, global growth in 2026 is forecast to be largely driven by countries in earlier stages of economic development, supported by population growth, workforce expansion, and rising consumption and government spending.
Learn More on the Voronoi App 
If you found this infographic interesting, explore more global economic insights on Voronoi, including BRICS vs. G7 Real GDP Growth in 2026.