Ranked: The Biggest Buyers and Sellers of U.S. Debt (2025)
See visuals like this from many other data creators on our Voronoi app. Download it for free on iOS or Android and discover incredible data-driven charts from a variety of trusted sources.
Key Takeaways
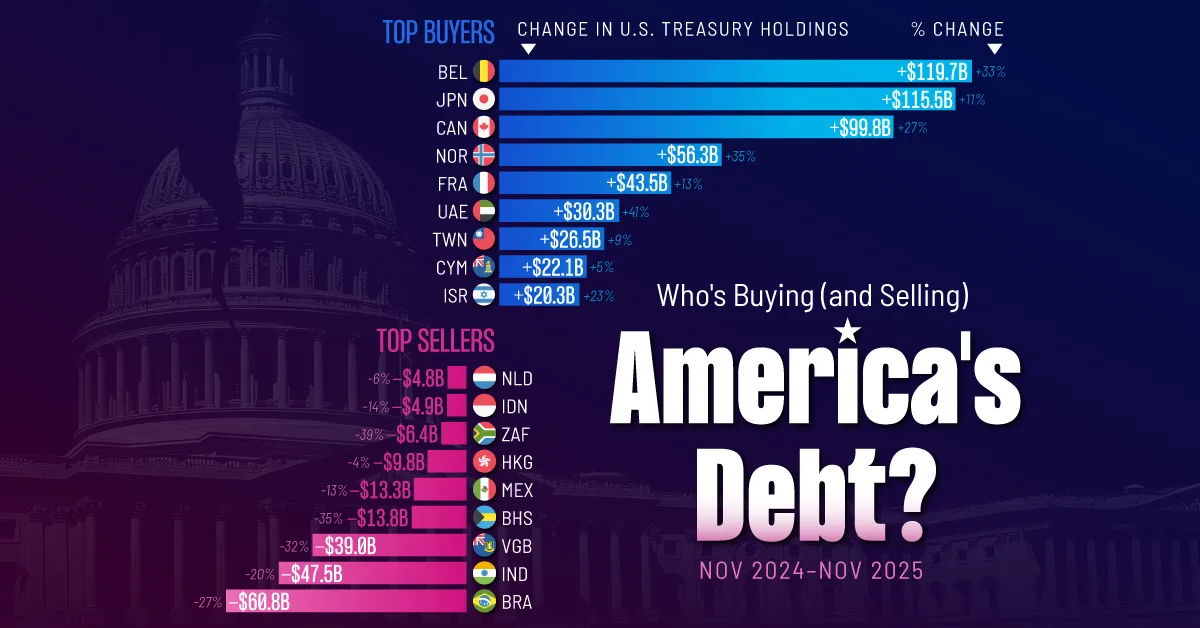
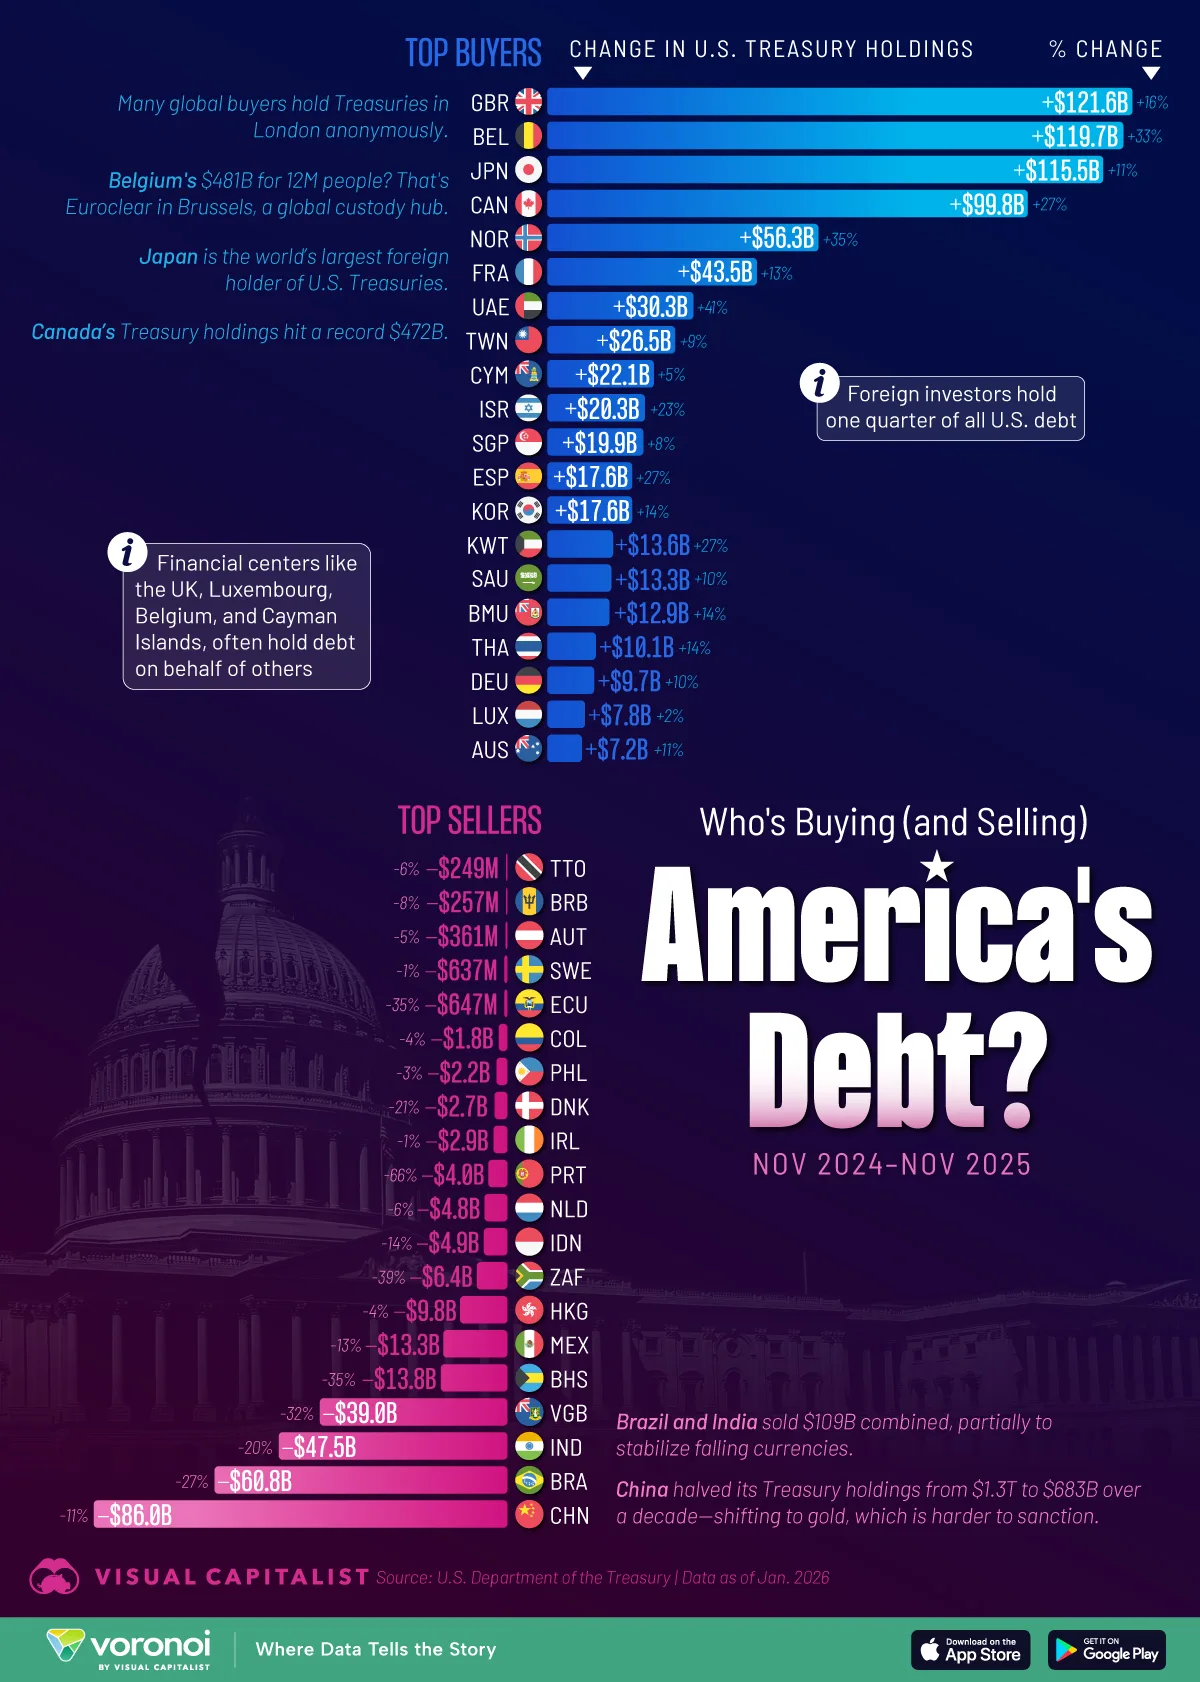
- The UK, Belgium, and Japan were the three largest buyers of U.S. debt from November 2024 to November 2025, each increasing holdings by more than $115 billion.
- China reduced its U.S. debt holdings by $86 billion over the same period, leading all countries in net selling.
- Despite major shifts among individual countries, total foreign holdings of U.S. Treasuries rose to a record $9.4 trillion.
Each year, the U.S. relies on investors to finance its growing debt, which stood at $38.6 trillion as of February 2026.
Both domestic and overseas investors buy this debt, with foreign holders of U.S. Treasuries owning a record $9.4 trillion of the total. While U.S. debt pays well due to its high yields currently, some countries, like China, have been selling their U.S. Treasury holdings.
This chart shows the countries that are the 20 largest buyers and sellers of U.S. Treasury securities from November 2024 to November 2025, based on data from the U.S. Treasury Department.
Europe and Japan Lead U.S. Treasury Buying
The table below shows the top countries buying U.S. Treasuries from November 2024 to November 2025, in both the U.S. dollar value and percentage change in relation to their Treasury holdings:
| Rank | Country | Change in U.S. Treasury Holdings (Millions, Nov 2024 – Nov 2025) | Percentage Change |
|---|---|---|---|
| 1 |  United Kingdom United Kingdom |
$121,613 | 16% |
| 2 |  Belgium Belgium |
$119,704 | 33% |
| 3 |  Japan Japan |
$115,528 | 11% |
| 4 |  Canada Canada |
$99,835 | 27% |
| 5 |  Norway Norway |
$56,335 | 35% |
| 6 |  France France |
$43,538 | 13% |
| 7 |  United Arab Emirates United Arab Emirates |
$30,335 | 41% |
| 8 |  Taiwan Taiwan |
$26,539 | 9% |
| 9 |  Cayman Islands Cayman Islands |
$22,131 | 5% |
| 10 |  Israel Israel |
$20,265 | 23% |
| 11 |  Singapore Singapore |
$19,934 | 8% |
| 12 |  Spain Spain |
$17,619 | 27% |
| 13 |  South Korea South Korea |
$17,605 | 14% |
| 14 |  Kuwait Kuwait |
$13,643 | 27% |
| 15 |  Saudi Arabia Saudi Arabia |
$13,283 | 10% |
| 16 |  Bermuda Bermuda |
$12,883 | 14% |
| 17 |  Thailand Thailand |
$10,061 | 14% |
| 18 |  Germany Germany |
$9,699 | 10% |
| 19 |  Luxembourg Luxembourg |
$7,811 | 2% |
| 20 |  Australia Australia |
$7,158 | 11% |
Three countries top $100 billion on the buyer side. The UK led at $122 billion, followed by Belgium and Japan, each within $6 billion of that mark. Canada and Norway rounded out the top five.
Together, these five accounted for roughly 65% of the $786 billion in total purchases.
Belgium’s 33% surge looks dramatic, but it is largely technical.
Brussels hosts Euroclear, a major clearinghouse that holds bonds on behalf of investors across Europe. Hence, the number can indicate where the debt is held rather than who actually purchased it.
The same logic applies to other financial hubs, such as the UK, the Cayman Islands, and Luxembourg.
China, Brazil, and India Lead U.S. Treasury Selling
The table below largest sellers of U.S. Treasuries from November 2024 to November 2025, in both the U.S. dollar value and percentage change in relation to their Treasury holdings:
| Rank | Country | Change in U.S. Treasury Holdings (Millions, Nov 2024 – Nov 2025) | Percentage Change |
|---|---|---|---|
| 1 |  China China |
-$85,960 | -11% |
| 2 |  Brazil Brazil |
-$60,847 | -27% |
| 3 |  India India |
-$47,517 | -20% |
| 4 |  British Virgin Islands British Virgin Islands |
-$38,956 | -32% |
| 5 |  Bahamas Bahamas |
-$13,822 | -35% |
| 6 |  Mexico Mexico |
-$13,320 | -13% |
| 7 |  Hong Kong Hong Kong |
-$9,821 | -4% |
| 8 |  South Africa South Africa |
-$6,356 | -39% |
| 9 |  Indonesia Indonesia |
-$4,865 | -14% |
| 10 |  Netherlands Netherlands |
-$4,750 | -6% |
| 11 |  Portugal Portugal |
-$3,959 | -66% |
| 12 |  Ireland Ireland |
-$2,876 | -1% |
| 13 |  Denmark Denmark |
-$2,663 | -21% |
| 14 |  Philippines Philippines |
-$2,246 | -3% |
| 15 |  Colombia Colombia |
-$1,780 | -4% |
| 16 |  Ecuador Ecuador |
-$647 | -35% |
| 17 |  Sweden Sweden |
-$637 | -1% |
| 18 |  Austria Austria |
-$361 | -5% |
| 19 |  Barbados Barbados |
-$257 | -8% |
| 20 |  Trinidad and Tobago Trinidad and Tobago |
-$249 | -6% |
China shed $86 billion in Treasuries, a further 11% annual decline that continues a multiyear reduction in U.S. debt holdings as Beijing diversifies its reserves into gold and other assets.
Other BRICS countries, such as Brazil and India, also cut their holdings by a combined $108 billion.
That move partly reflects governments’ efforts to defend their own currencies by drawing on dollar reserves, but could also point to a continuous trend of de-dollarization.
Learn More on the Voronoi App 
To learn more about the U.S. debt, check out this graphic which visualizes it all in one dollar bills on Voronoi.