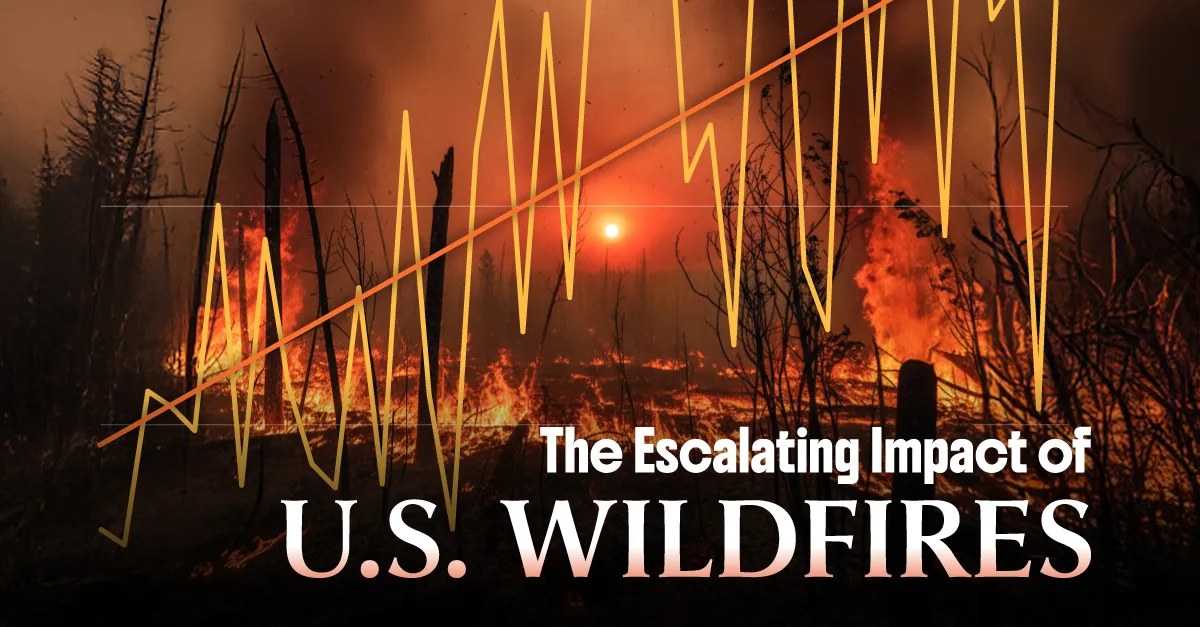
The Escalating Destruction of U.S. Wildfires
Key Takeaways
- Wildfires in the United States are becoming more destructive as climate conditions intensify and development expands into fire-prone areas.
- The area burned by wildfires has trended upward, with many of the most severe seasons occurring in the past decade.
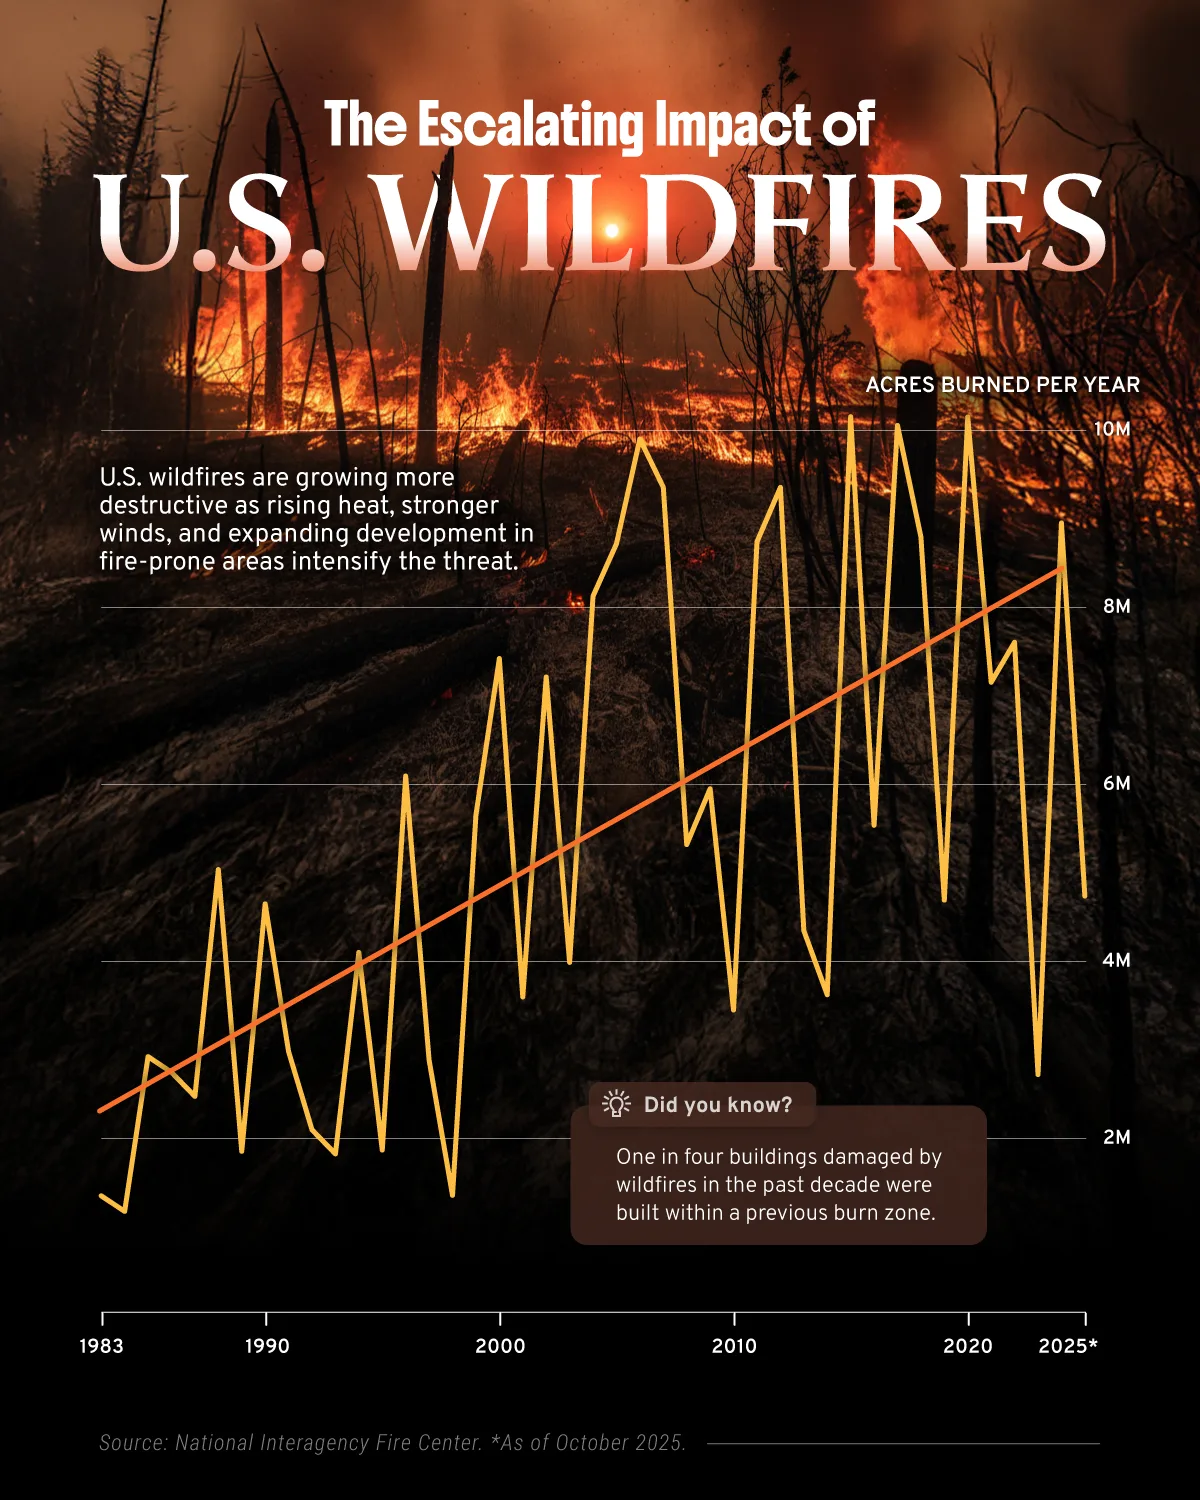
- In 2024, nearly 9 million acres were burned, far exceeding the 40-year average of approximately 5 million acres.
Wildfires across the United States are becoming more destructive and more costly. Data from the National Interagency Fire Center shows that the annual area burned has increased over time, with several of the most severe wildfire seasons on record occurring within the past decade.
Created in partnership with Inigo, this visualization provides visual context for the rising impact of U.S. wildfires.
Wildfires Are Burning Hotter and Spreading Wider
Across the country, rising temperatures, prolonged droughts, and stronger winds are intensifying fire behavior, even as housing development pushes further into fire-prone areas.
In January 2025 alone, California wildfires burned 64,038 acres, the third-highest January total on record. The figure shows that extreme fire conditions are no longer limited to peak summer months.
| Year | Acres Burned |
|---|---|
| Jan.-Oct. 2025 | 4,711,179 |
| 2024 | 8,924,884 |
| 2023 | 2,693,910 |
| 2022 | 7,577,183 |
| 2021 | 7,125,643 |
| 2020 | 10,122,336 |
| 2019 | 4,664,364 |
| 2018 | 8,767,492 |
| 2017 | 10,026,086 |
| 2016 | 5,509,995 |
| 2015 | 10,125,149 |
| 2014 | 3,595,613 |
| 2013 | 4,319,546 |
| 2012 | 9,326,238 |
| 2011 | 8,711,367 |
| 2010 | 3,422,724 |
| 2009 | 5,921,786 |
| 2008 | 5,292,468 |
| 2007 | 9,328,045 |
| 2006 | 9,873,745 |
| 2005 | 8,689,389 |
| 2004 | 8,097,880 |
| 2003 | 3,960,842 |
| 2002 | 7,184,712 |
| 2001 | 3,570,911 |
| 2000 | 7,393,493 |
| 1999 | 5,626,093 |
| 1998 | 1,329,704 |
| 1997 | 2,856,959 |
| 1996 | 6,065,998 |
| 1995 | 1,840,546 |
| 1994 | 4,073,579 |
| 1993 | 1,797,574 |
| 1992 | 2,069,929 |
| 1991 | 2,953,578 |
| 1990 | 4,621,621 |
| 1989 | 1,827,310 |
| 1988 | 5,009,290 |
| 1987 | 2,447,296 |
| 1986 | 2,719,162 |
| 1985 | 2,896,147 |
| 1984 | 1,148,409 |
| 1983 | 1,323,666 |
Although the most destructive wildfire years occurred across several decades, the broader pattern remains unmistakable. The long-term trend in acres burned is steadily rising.
In 2024, nearly 9 million acres burned, far exceeding the 40-year average of just over 5 million acres. Only two years in the past decade recorded fewer acres burned.
Why Exposure Is Compounding
The expanding overlap between people, property, and high-risk terrain is amplifying both human and economic exposure. Over the past decade, wildfires damaged one in four buildings that stood within a previous burn zone, highlighting how rebuilding in the same areas can magnify future losses.
Insurers, property owners, and policymakers can no longer treat wildfire risk as a regional issue confined to the Western states. It is a national challenge reshaping how communities build, insure, and recover. As climate volatility increases, understanding where fires are occurring and how risk is accumulating will be critical to managing future losses.

Explore the data behind emerging global property risks.
-
 Real Estate1 day ago
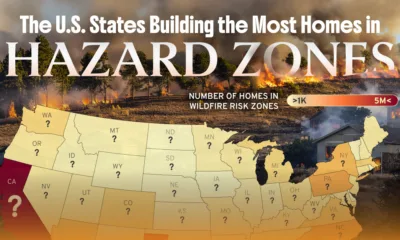
Mapped: The U.S. States Building the Most Homes in the Fire Line
As housing spreads into the fire line, exposure is rising sharply, compounding loss potential and challenging long-term insurability.
-

 Real Estate2 days ago
4 Inputs Driving the Rising Cost of Rebuilding
Rising labor and material costs mean every insured dollar now rebuilds less, widening the recovery gap after disasters across the United States.
-
 Real Estate5 days ago
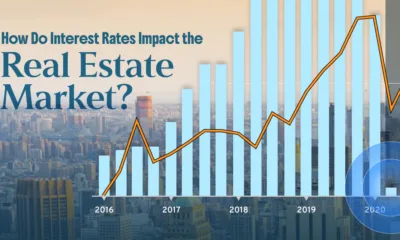
How Do Interest Rates Impact the Real Estate Market?
Lower interest rates have often supported stronger real estate returns and improved valuations. Will that trend return in 2026?
-

 Real Estate1 week ago
6 Trends Reshaping U.S. Property Insurance
From climate volatility to economic and technological shifts, a wide range of forces are reshaping property risk in the U.S.
-

 Environment4 months ago
Ranked: The 10 Most Powerful U.S. Hurricanes (1900-2025)
Hurricanes are a defining force in the U.S. climate, capable of leaving behind profound environmental, social, and economic devastation.
-
 Environment5 months ago
Mapped: Which U.S. Cities Saw Record-Breaking Temperatures in 2024?
Global temperatures are climbing—but how is this trend playing out across the United States, and which regions are being hit the hardest?
-

 Environment6 months ago
Ranked: The Most Expensive U.S. Wildfire Events, So Far
Wildfire events are growing increasingly frequent and destructive around the world as human-driven climate impacts continue to escalate.
-
 Environment6 months ago
Mapped: The United States of Drought
Drought grips much of the U.S., affecting over 60 million people today.
-

 Healthcare7 months ago
The $58B Weight Loss Drug Market in One Chart
Weight loss drugs have surged in popularity in recent years, transforming the pharmaceutical landscape. Which brands are dominating this space?
-

 Healthcare7 months ago
Ranked: Which Areas Receive the Most Pharma R&D?
The pharmaceutical industry has made enormous strides in treating—and even curing—a wide range of diseases and conditions. Which areas are seeing the most R&D in 2025?
-

 Healthcare7 months ago
The $5.6T Pharmaceutical Industry in One Chart
Pharma giants don’t just make medicine—they shape the future of healthcare. Who are the world’s major players?
-

 Crime7 months ago
6 Fraud Trends Reshaping Risk in 2025
The fraud and financial crime landscapes are evolving rapidly. What are the key threats shaping risk in 2025?
-

 Cryptocurrency7 months ago
Ranked: The 10 Biggest Digital Heists
Some of the largest digital heists didn’t rely on brute-force hacking, they exploited the weakest link in security: human trust.
-

 Crime8 months ago
The Most Costly Financial Crimes in 2024
As cybersecurity threats escalate, which financial crimes are causing the most harm? The FBI has the data.
-
 Crime8 months ago
Mapped: U.S. Financial Crime Activity by State
Suspicious activity has been rising in the U.S., but is it spread evenly throughout all 50 states? Certainly not.
-

 Crime8 months ago
Ranked: America’s Most Common Financial Crimes
As technology and AI become more widespread, fraud and other suspicious activity are rising across America. Which types are the most common?
-

 Economy8 months ago
Tracking the $3.1 Trillion Financial Crime Pandemic
From money laundering to fraud, financial crime acts as a drain on the economy, totaling an incredible $3.1 trillion.
-

 Politics9 months ago
Which Types of Government Rule the World?
Over half the global population is ruled by non-centrist types of government, including autocracies and left or right wing parties.
-

 Politics9 months ago
Breaking Down the $524 Billion Investment Needed to Rebuild Ukraine
Ukraine will require an estimated $524B over the next decade to recover from the Russia-Ukraine war. Which sectors have been most impacted?
-
 Politics9 months ago
Are Tariffs Causing U.S. Inflation Fears?
Amid tariff increases, consumers’ expectations for U.S. inflation in the next five years have reached their highest level since March 1991.
-

 Politics10 months ago
Ranked: Executive Orders by President in the First 100 Days
In his first 100 days, President Trump has issued far more executive orders than any other president in history.
- Source: https://www.visualcapitalist.com/sp/ig01-charted-the-escalating-destruction-of-u-s-wildfires/