Mapped: The Share of Each Country That Lives in Its Largest City
See visuals like this from many other data creators on our Voronoi app. Download it for free on iOS or Android and discover incredible data-driven charts from a variety of trusted sources.
Key Takeaways
- In some countries, nearly 100% of urban residents live in a single city.
- In giants like the U.S., China, and India, less than 10% live in their largest metro.
- Globally, just 16% of urban residents live in their country’s biggest city.
In some nations, one city towers over the rest. In others, populations are spread across multiple large metros with no single dominant hub.
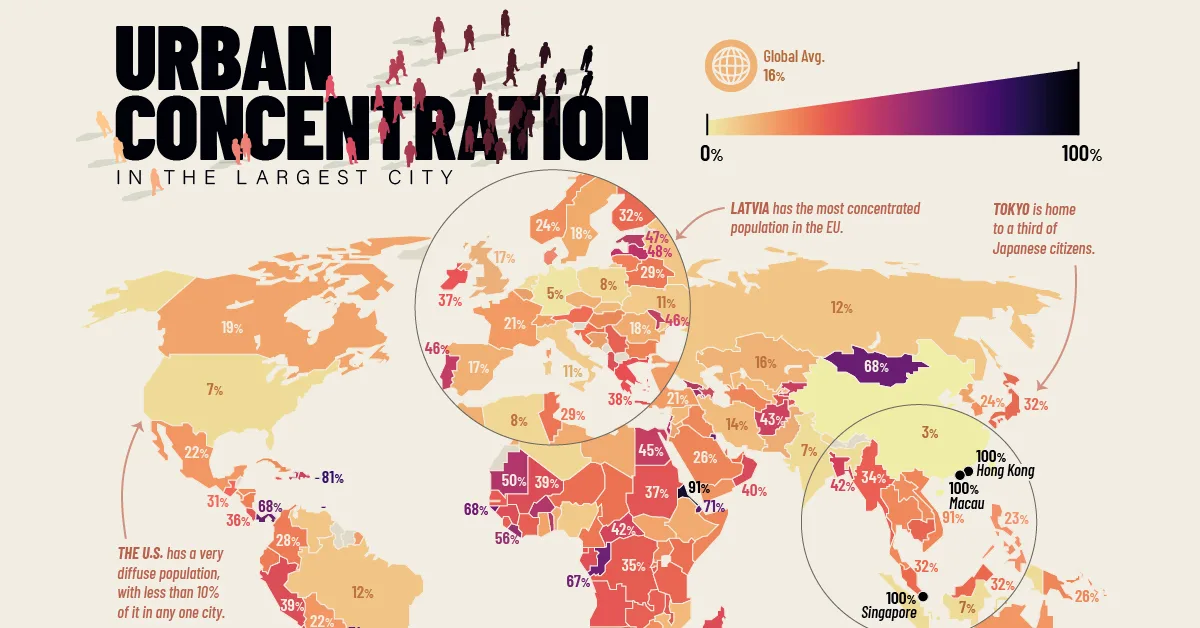
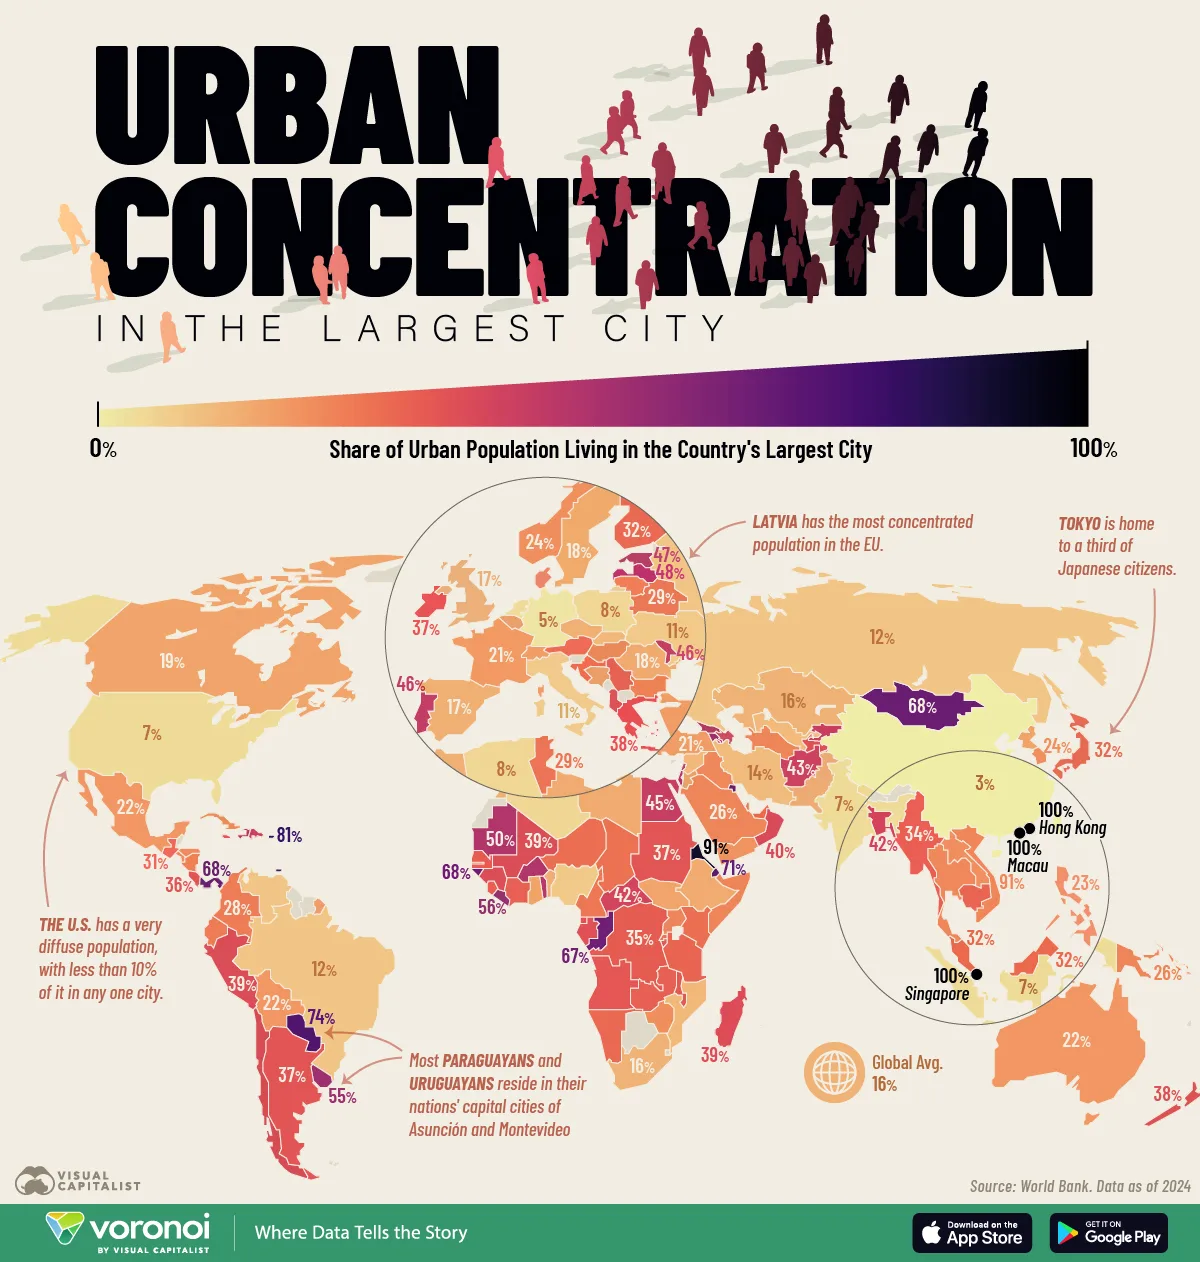
This map shows the share of each country’s urban population living in its largest city, revealing where megacities dominate and where people are far more dispersed. The data for this map comes from the World Bank.
Globally, only 16% of urban residents live in their country’s largest city, suggesting that in most places, population and economic activity are distributed across several urban centers rather than concentrated in just one.
The Most Heavily-Concentrated Countries Worldwide
The city-state of Singapore, alongside the two Chinese special administrative regions of Hong Kong and Macau, top the list, while giants like China, India, Russia, and the United States see less than 10% of their population reside in their largest cities.
This data table below shows each country’s share of urban population living in the country’s largest city:
| Country | Share of urban population living in the country’s largest city |
|---|---|
 Hong Kong SAR, China Hong Kong SAR, China |
100% |
 Macao SAR, China Macao SAR, China |
100% |
 Singapore Singapore |
100% |
 Eritrea Eritrea |
91% |
 Puerto Rico (U.S.) Puerto Rico (U.S.) |
81% |
 Paraguay Paraguay |
74% |
 Trinidad and Tobago Trinidad and Tobago |
74% |
 Djibouti Djibouti |
71% |
 Guinea-Bissau Guinea-Bissau |
68% |
 Kuwait Kuwait |
68% |
 Mongolia Mongolia |
68% |
 Panama Panama |
68% |
 Congo, Rep. Congo, Rep. |
67% |
 Liberia Liberia |
56% |
 Armenia Armenia |
55% |
 Uruguay Uruguay |
55% |
 North Macedonia North Macedonia |
54% |
 Burkina Faso Burkina Faso |
50% |
 Mauritania Mauritania |
50% |
 Israel Israel |
49% |
 Togo Togo |
49% |
 Georgia Georgia |
48% |
 Latvia Latvia |
48% |
 Estonia Estonia |
47% |
 Haiti Haiti |
47% |
 Bahrain Bahrain |
46% |
 Lebanon Lebanon |
46% |
 Moldova Moldova |
46% |
 Portugal Portugal |
46% |
 Egypt, Arab Rep. Egypt, Arab Rep. |
45% |
 Kyrgyz Republic Kyrgyz Republic |
45% |
 Afghanistan Afghanistan |
43% |
 Dominican Republic Dominican Republic |
43% |
 Bangladesh Bangladesh |
42% |
 Central African Republic Central African Republic |
42% |
 Azerbaijan Azerbaijan |
41% |
 Chile Chile |
40% |
 Oman Oman |
40% |
 Guinea Guinea |
39% |
 Madagascar Madagascar |
39% |
 Mali Mali |
39% |
 Peru Peru |
39% |
 Albania Albania |
38% |
 Gabon Gabon |
38% |
 Greece Greece |
38% |
 New Zealand New Zealand |
38% |
 Argentina Argentina |
37% |
 Burundi Burundi |
37% |
 Equatorial Guinea Equatorial Guinea |
37% |
 Ireland Ireland |
37% |
 Sudan Sudan |
37% |
 Tajikistan Tajikistan |
37% |
 Angola Angola |
36% |
 Costa Rica Costa Rica |
36% |
 Jamaica Jamaica |
36% |
 Malawi Malawi |
36% |
 Congo, Dem. Rep. Congo, Dem. Rep. |
35% |
 Senegal Senegal |
35% |
 Cote d’Ivoire Cote d’Ivoire |
34% |
 Myanmar Myanmar |
34% |
 Sierra Leone Sierra Leone |
34% |
 Serbia Serbia |
34% |
 Zambia Zambia |
34% |
 Cambodia Cambodia |
33% |
 Tanzania Tanzania |
33% |
 United Arab Emirates United Arab Emirates |
32% |
 Finland Finland |
32% |
 Japan Japan |
32% |
 Malaysia Malaysia |
32% |
 Namibia Namibia |
32% |
 Austria Austria |
31% |
 Guatemala Guatemala |
31% |
 Croatia Croatia |
31% |
 Kenya Kenya |
31% |
 Niger Niger |
31% |
 Rwanda Rwanda |
30% |
 Chad Chad |
30% |
 Belarus Belarus |
29% |
 Cameroon Cameroon |
29% |
 Qatar Qatar |
29% |
 Tunisia Tunisia |
29% |
 Colombia Colombia |
28% |
 Ecuador Ecuador |
28% |
 Gambia, The Gambia, The |
28% |
 Bulgaria Bulgaria |
27% |
 Lithuania Lithuania |
27% |
 Nicaragua Nicaragua |
27% |
 Denmark Denmark |
26% |
 Hungary Hungary |
26% |
 Papua New Guinea Papua New Guinea |
26% |
 Saudi Arabia Saudi Arabia |
26% |
 Somalia, Fed. Rep. Somalia, Fed. Rep. |
26% |
 Turkmenistan Turkmenistan |
26% |
 Uganda Uganda |
26% |
 Cuba Cuba |
25% |
 Honduras Honduras |
25% |
 Iraq Iraq |
25% |
 Thailand Thailand |
25% |
 Viet Nam Viet Nam |
25% |
 Korea, Rep. Korea, Rep. |
24% |
 Lao PDR Lao PDR |
24% |
 Norway Norway |
24% |
 El Salvador El Salvador |
24% |
 Zimbabwe Zimbabwe |
24% |
 Philippines Philippines |
23% |
 Yemen, Rep. Yemen, Rep. |
23% |
 Australia Australia |
22% |
 Bolivia Bolivia |
22% |
 Mexico Mexico |
22% |
 Belgium Belgium |
21% |
 Bosnia and Herzegovina Bosnia and Herzegovina |
21% |
 France France |
21% |
 Jordan Jordan |
21% |
 Turkiye Turkiye |
21% |
 Canada Canada |
19% |
 Switzerland Switzerland |
19% |
 Ghana Ghana |
19% |
 Korea, Dem. People’s Rep. Korea, Dem. People’s Rep. |
19% |
 South Sudan South Sudan |
19% |
 Ethiopia Ethiopia |
18% |
 Libya Libya |
18% |
 Pakistan Pakistan |
18% |
 Romania Romania |
18% |
 Sweden Sweden |
18% |
 Benin Benin |
17% |
 Czechia Czechia |
17% |
 Spain Spain |
17% |
 United Kingdom United Kingdom |
17% |
 Morocco Morocco |
17% |
 West Bank and Gaza West Bank and Gaza |
17% |
 European Union European Union |
16% |
 Kazakhstan Kazakhstan |
16% |
 South Africa South Africa |
16% |
 Mozambique Mozambique |
15% |
 Slovak Republic Slovak Republic |
15% |
 Syrian Arab Republic Syrian Arab Republic |
15% |
 Iran, Islamic Rep. Iran, Islamic Rep. |
14% |
 Sri Lanka Sri Lanka |
14% |
 Uzbekistan Uzbekistan |
14% |
 Brazil Brazil |
12% |
 Russian Federation Russian Federation |
12% |
 Venezuela, RB Venezuela, RB |
12% |
 Italy Italy |
11% |
 Nigeria Nigeria |
11% |
 Ukraine Ukraine |
11% |
 Algeria Algeria |
8% |
 Nepal Nepal |
8% |
 Poland Poland |
8% |
 Indonesia Indonesia |
7% |
 India India |
7% |
 Netherlands Netherlands |
7% |
 United States United States |
7% |
 Germany Germany |
5% |
 China China |
3% |
Even within similar regions, there are clear gaps. Roughly a fifth of Britons, Spaniards, and Frenchmen reside in their national capitals and largest cities; in contrast, Germans and Poles are far more spread out across their countries.
Across the 27-member European Union, no subregion is more concentrated than the Baltic states: Estonia and Latvia lead the continent with 47-48% of their populations residing in the national capitals of Tallinn and Riga.
Disparate Population Distribution in the Americas
North and South America are home to some of the world’s largest cities, from São Paulo and Mexico City to New York and Toronto. Yet in each of these cases the sprawling metropolises tend to actually hold a smaller share of the citizenry than smaller capital cities such as Lima, Asuncion, or Montevideo.
For many countries in the region, such as Argentina or Colombia, post-independence history has been fraught with concerns over centralization versus decentralization.
What are Primate Cities?
The term “primate city” was first coined in 1939 by geographer Mark Jefferson to describe any city that is “at least twice as large as the next largest city and more than twice as significant” within a given country.
Modern capitals such as Algiers, Paris, Bangkok, and Buenos Aires are classic primate city case studies, serving as the economic, demographic, and social centers of their respective countries.
Countries with primate cities often see a heavy concentration of economic output, infrastructure, and internal migration in one metropolitan area. By contrast, federal systems such as Brazil, India, and the United States tend to develop multiple large cities that balance national influence.
Learn More on the Voronoi App 
If you enjoyed today’s post, check out The 50 Largest Cities in Africa by Population on Voronoi.