Mapped: The U.S. States With the Most Tech Jobs in 2025
See visuals like this from many other data creators on our Voronoi app. Download it for free on iOS or Android and discover incredible data-driven charts from a variety of trusted sources.
Key Takeaways
- The top three states (CA, NY, TX) alone account for over 1 million tech jobs, highlighting how concentrated the industry remains.
- Washington (171,000) and Florida (161,000) round out the top five, forming a clear upper tier well ahead of the rest of the country.
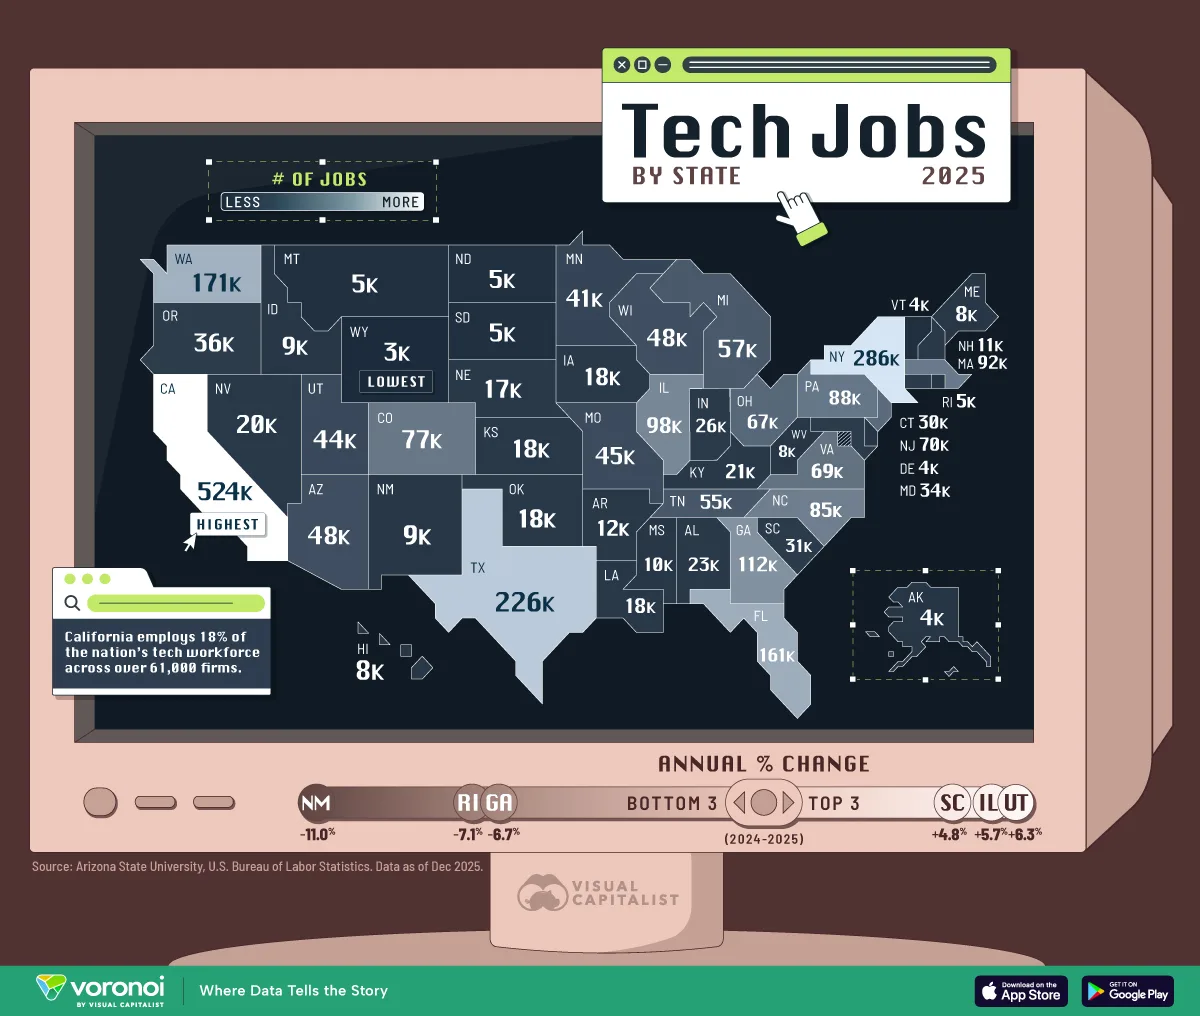
- Utah (+6.3%), Illinois (+5.7%), and South Carolina (+4.8%) posted the fastest annual growth rates, signaling momentum beyond the largest tech hubs.
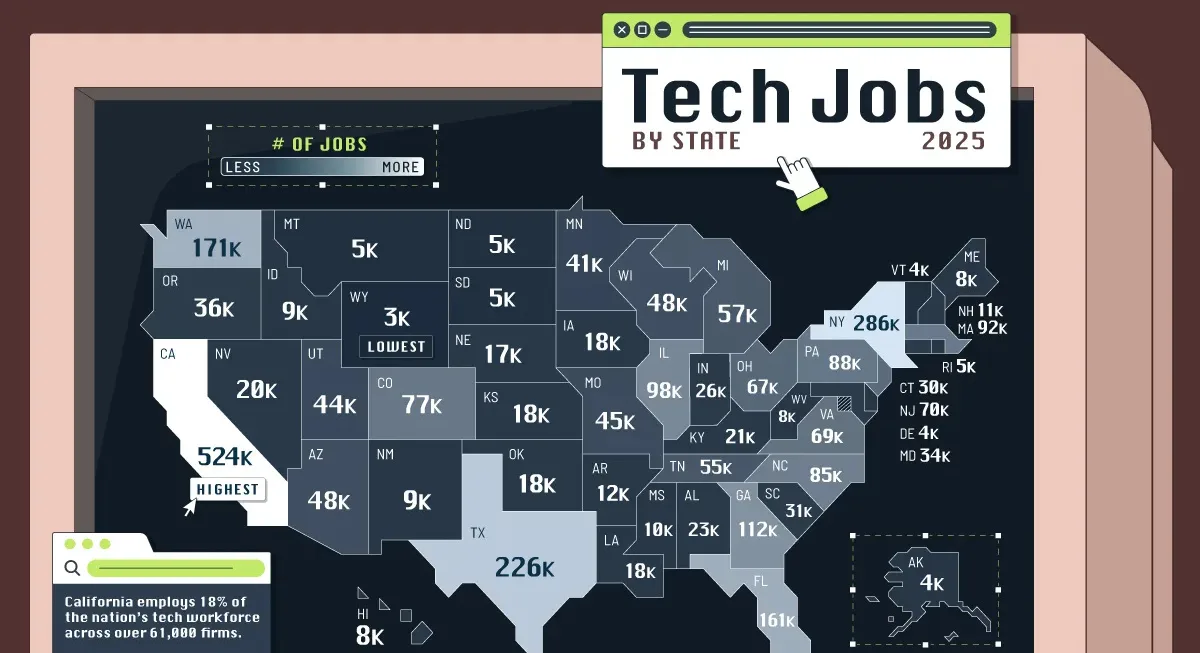
California alone employs more than half a million tech workers, nearly twice as many as the next closest state.
This map shows where America’s tech jobs are located in 2025, highlighting how heavily the industry is concentrated in just a handful of states.
Figures are based on Bureau of Labor Statistics data via Arizona State University.
Ranked: Tech Jobs by State in 2025
Nationwide, tech employment totals roughly 3.2 million workers in 2025.
In the below table, we break down the number of tech jobs in each state, along with its growth rate over the last year.
| Rank | State | Number of Jobs 2025 | Annual Job Growth |
|---|---|---|---|
| 1 | California | 524K | -2.8% |
| 2 | New York | 286K | 0.0% |
| 3 | Texas | 226K | -2.0% |
| 4 | Washington | 171K | 3.0% |
| 5 | Florida | 161K | 0.5% |
| 6 | Georgia | 112K | -6.7% |
| 7 | Illinois | 98K | 5.7% |
| 8 | Massachusetts | 92K | 0.3% |
| 9 | Pennsylvania | 88K | -2.0% |
| 10 | North Carolina | 85K | -0.9% |
| 11 | Colorado | 77K | 4.6% |
| 12 | New Jersey | 70K | -4.5% |
| 13 | Virginia | 69K | -4.2% |
| 14 | Ohio | 67K | 1.4% |
| 15 | Michigan | 57K | -0.4% |
| 16 | Tennessee | 55K | -0.7% |
| 17 | Wisconsin | 48K | -1.6% |
| 18 | Arizona | 48K | -0.6% |
| 19 | Missouri | 45K | -2.8% |
| 20 | Utah | 44K | 6.3% |
| 21 | Minnesota | 41K | -4.2% |
| 22 | Oregon | 36K | -0.8% |
| 23 | Maryland | 34K | -1.2% |
| 24 | South Carolina | 31K | 4.8% |
| 25 | Connecticut | 30K | -0.7% |
| 26 | Indiana | 26K | -1.1% |
| 27 | Alabama | 23K | 0.4% |
| 28 | Kentucky | 21K | -1.0% |
| 29 | Nevada | 20K | -0.5% |
| 30 | Oklahoma | 18K | 2.3% |
| 31 | Louisiana | 18K | -4.7% |
| 32 | Iowa | 18K | 0.0% |
| 33 | Kansas | 18K | 2.3% |
| 34 | Nebraska | 17K | -2.3% |
| 35 | Arkansas | 12K | -4.1% |
| 36 | New Hampshire | 11K | -0.9% |
| 37 | Mississippi | 10K | -1.0% |
| 38 | Idaho | 9K | 0.0% |
| 39 | New Mexico | 9K | -11.0% |
| 40 | Hawaii | 8K | -2.4% |
| 41 | West Virginia | 8K | -1.3% |
| 42 | Maine | 8K | -4.8% |
| 43 | North Dakota | 5K | 1.9% |
| 44 | Montana | 5K | -5.3% |
| 45 | South Dakota | 5K | 0.0% |
| 46 | Rhode Island | 5K | -7.1% |
| 47 | Vermont | 4K | -6.5% |
| 48 | Alaska | 4K | -4.7% |
| 49 | Delaware | 4K | 0.0% |
| 50 | Wyoming | 3K | -3.3% |
With 524,000 tech workers, California employs 18% of the nation’s tech workforce across over 61,000 firms.
Still, the state shed thousands of tech jobs last year, given economic uncertainty and the spillover effects of AI. Overall, tech jobs contracted 2.8% in 2025.
New York follows, with 286,000 tech workers, equal to one in 10 jobs nationwide. In 2025, tech job growth was effectively flat.
Ranking in third is Texas, with tech employment standing at 226,000. As a growing tech hub, the state has added over 26,000 roles in the sector since 2020. Last year, however, the number of roles contracted by 2%.
In contrast to these heavyweight states, several smaller tech hubs posted strong job growth. Utah’s tech workforce totals just 44,000, yet employment climbed 6.3% in 2025. Illinois, South Carolina, and Colorado—each with fewer than 100,000 tech jobs—saw gains of 5.8%, 4.8%, and 4.6%, respectively.
Learn More on the Voronoi App 
To learn more about this topic, check out this graphic on the world’s top 50 science and technology clusters.