Mapped: U.S. States With the Highest Diabetes Rates
See visuals like this from many other data creators on our Voronoi app. Download it for free on iOS or Android and discover incredible data-driven charts from a variety of trusted sources.
Key Takeaways
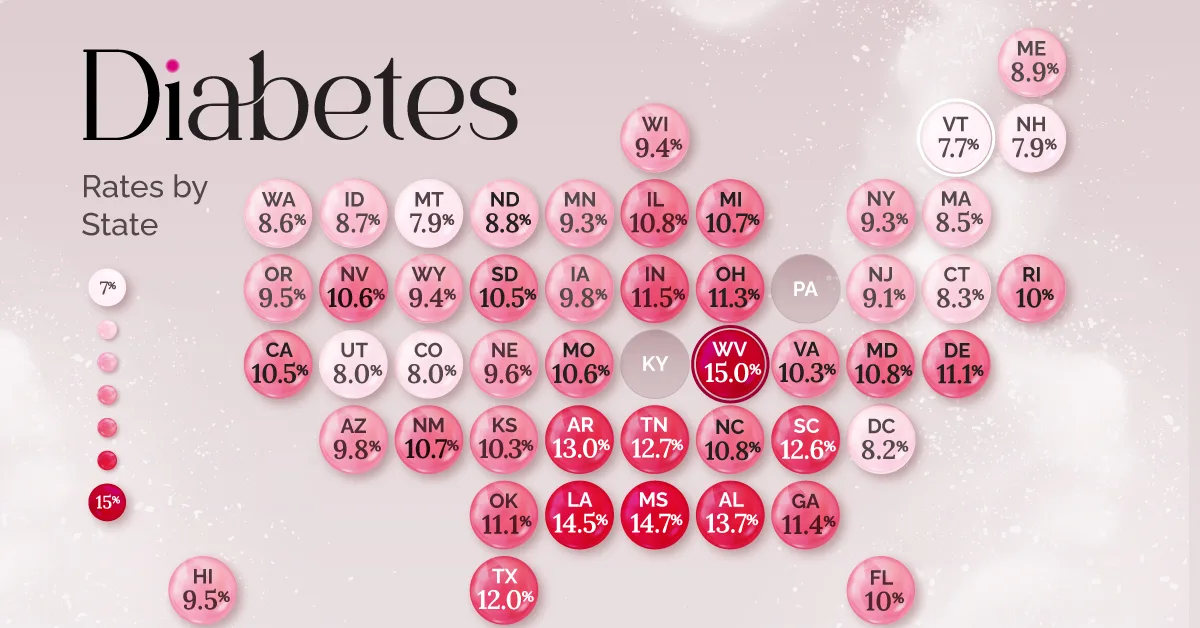
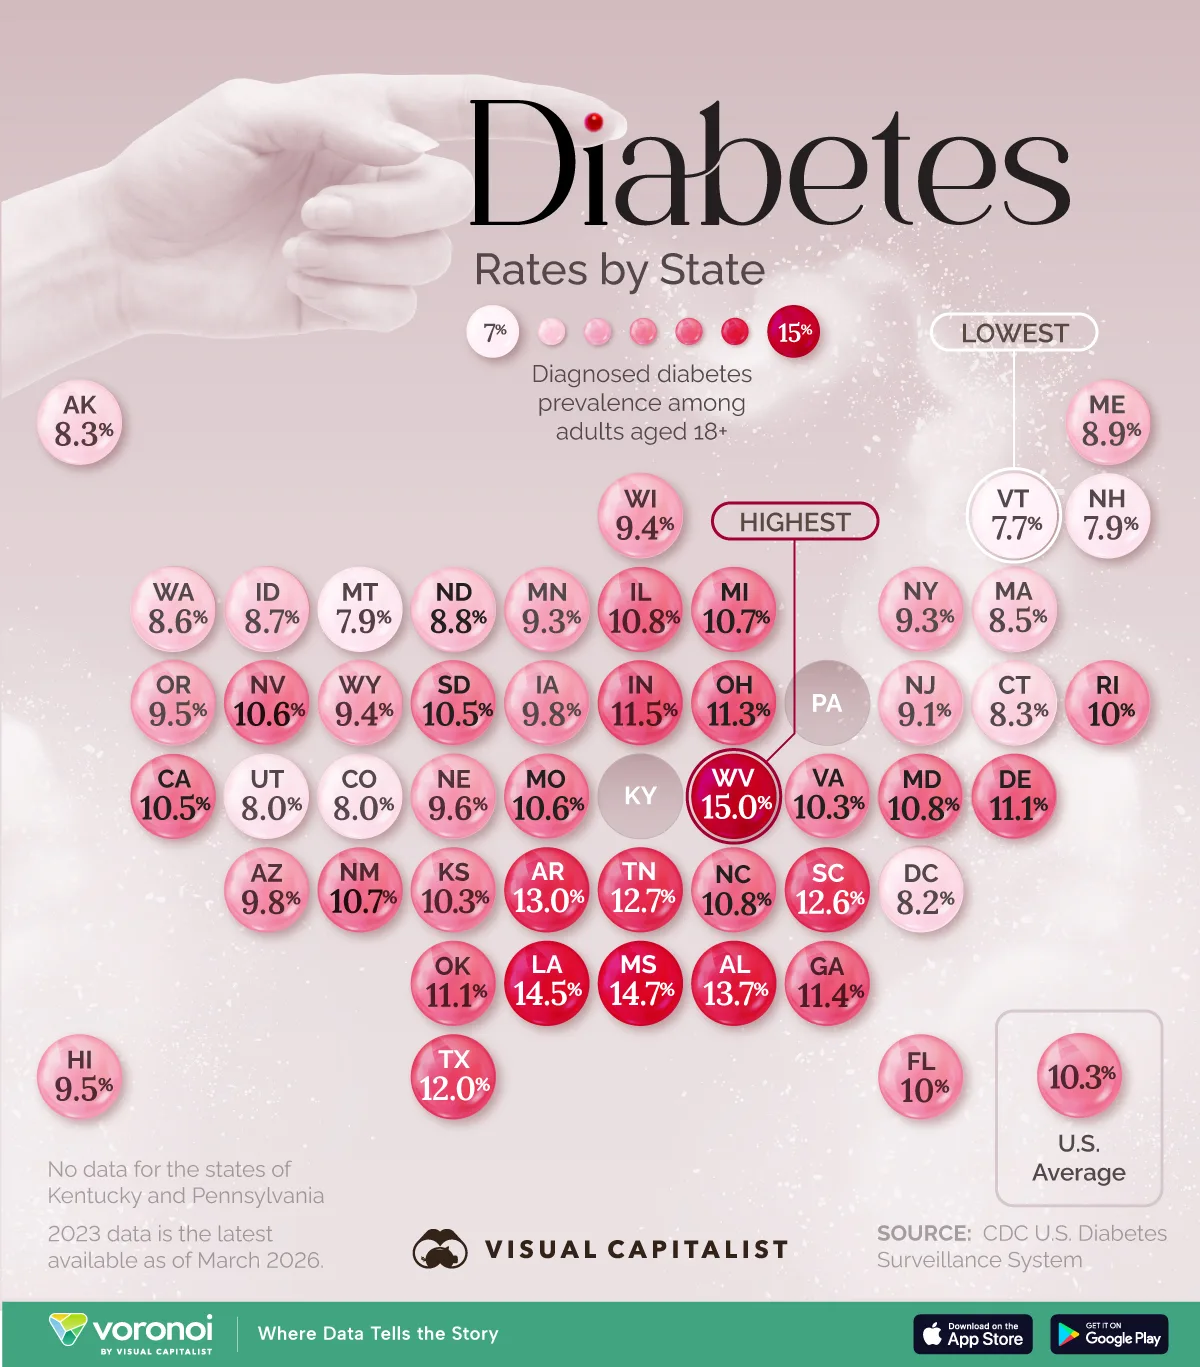
- West Virginia has the highest diabetes prevalence in the U.S., with 15% of adults diagnosed.
- Vermont reports the lowest rate at 7.7%, nearly half the level of the highest states.
- Many Southern states report rates well above the national average of 10.3%.
West Virginia has the highest diabetes prevalence in the U.S., with 15% of adults diagnosed, according to the latest data from the CDC.
The map above shows how diabetes rates compare across all 50 states using the CDC U.S. Diabetes Surveillance System for 2023. Several Southern states rank among the highest in the country, while parts of the Mountain West and New England report some of the lowest prevalence levels.
The South Has the Highest Diabetes Rates
Many of the states with the highest diabetes prevalence are located in the U.S. South. West Virginia leads the nation, with 15% of adults diagnosed with diabetes, followed by Mississippi (14.7%) and Louisiana (14.5%).
Other Southern states—including Alabama, Arkansas, Tennessee, and South Carolina—also report rates well above the national average. These patterns are often linked to higher rates of obesity, lower physical activity levels, and socioeconomic disparities.
| State | Percentage (%) |
|---|---|
| West Virginia | 15.0% |
| Mississippi | 14.7% |
| Louisiana | 14.5% |
| Alabama | 13.7% |
| Arkansas | 13.0% |
| Tennessee | 12.7% |
| South Carolina | 12.6% |
| Texas | 12.0% |
| Indiana | 11.5% |
| Georgia | 11.4% |
| Ohio | 11.3% |
| Delaware | 11.1% |
| Oklahoma | 11.1% |
| Illinois | 10.8% |
| Maryland | 10.8% |
| North Carolina | 10.8% |
| Michigan | 10.7% |
| New Mexico | 10.7% |
| Missouri | 10.6% |
| Nevada | 10.6% |
| California | 10.5% |
| South Dakota | 10.5% |
| Median of States | 10.3% |
| Kansas | 10.3% |
| Virginia | 10.3% |
| Florida | 10.0% |
| Rhode Island | 10.0% |
| Arizona | 9.8% |
| Iowa | 9.8% |
| Nebraska | 9.6% |
| Hawaii | 9.5% |
| Oregon | 9.5% |
| Wisconsin | 9.4% |
| Wyoming | 9.4% |
| Minnesota | 9.3% |
| New York | 9.3% |
| New Jersey | 9.1% |
| Maine | 8.9% |
| North Dakota | 8.8% |
| Idaho | 8.7% |
| Washington | 8.6% |
| Massachusetts | 8.5% |
| Alaska | 8.3% |
| Connecticut | 8.3% |
| District of Columbia | 8.2% |
| Colorado | 8.0% |
| Utah | 8.0% |
| Montana | 7.9% |
| New Hampshire | 7.9% |
| Vermont | 7.7% |
| Kentucky | No data |
| Pennsylvania | No data |
Texas also ranks among the higher-prevalence states, with 12% of adults diagnosed with diabetes.
Most States Cluster Near the National Average
Despite large differences at the extremes, many states fall close to the U.S. average of 10.3%. States such as Kansas and Virginia sit almost exactly at this level.
Several populous states—including California, Illinois, and North Carolina—also report prevalence rates slightly above the national average. This clustering suggests that while regional trends exist, diabetes remains a widespread health challenge across the entire country.
Public health initiatives focusing on prevention, early screening, and lifestyle changes remain central to reducing these rates.
Lower Rates in the Mountain West and New England
Some of the lowest diabetes prevalence rates appear in the Mountain West and parts of New England. Vermont reports the lowest rate at 7.7%, followed by Montana and New Hampshire at 7.9%.
Colorado and Utah also report relatively low rates at around 8%, while several Northeastern states—including Massachusetts and Connecticut—remain below the national average.
Learn More on the Voronoi App 
If you enjoyed today’s post, check out Mapped: Alcohol Spending Per Capita, by U.S. State on Voronoi, the new app from Visual Capitalist.