At the Department of Agriculture’s research division, everyone knows there’s one word they should never say, according to Ethan Roberts. “The forbidden C-word” — climate.
Roberts, union president at the National Center for Agricultural Utilization Research in Peoria, Illinois, has worked for the federal government for nearly a decade. In that time, the physical science technician has weathered several political administrations, including President Donald Trump’s first term. None compare to what’s happening now.
The sweeping transformation became apparent last March, after a memo from upper management at the USDA Agricultural Research Service instructed staffers to avoid submitting agreements and other contracts that used any of 100-plus newly banned words and phrases. Roughly a third directly related to climate change, including “global warming,” “climate science,” and “carbon sequestration.”
Roberts met with his union to figure out how to respond to the memo. They concluded that the best course of action was just to avoid the terms and try to get their research published by working around them. Throughout the federal agency, “climate change” was swapped for softer synonyms: “elevated temperatures,” “soil health,” and “extreme weather.”
It’s part of a bigger trend. Across federal agencies and academic institutions, scientists are avoiding words they once used without hesitation. When Trump took office last year — calling coal “clean” and “beautiful” while deriding plans to tackle climate change as a “green scam” — a so-called “climate hushing” took hold of the United States, as businesses, politicians, and even the news media got quieter about global warming. There’s a long list of supposedly “woke” words that agencies have been discouraged from using, many tied to climate change or diversity, equity, and inclusion initiatives.
The language changes were accompanied by larger shifts in how the federal government operates. Elon Musk’s Department of Government Efficiency, known as DOGE, laid off hundreds of thousands of federal workers last year. The Trump administration also slashed spending on science, cutting tens of billions of dollars in grants for projects related to the environment and public lands. Researchers are adapting to the new landscape, with some finding creative ways to continue their climate research, from changing their wording to seeking out different sources of funding.
For federal researchers studying, say, the interplay between weather patterns and soybean diseases, the key is to reframe studies so they don’t clash with the Trump administration’s politics. “Instead of making it about the climate, you would instead just make it about the disease itself, and be like, ‘This disease does these things under these conditions,’ rather than ‘These conditions cause this disease to do this,’” Roberts added. “It’s just changing the focus.”
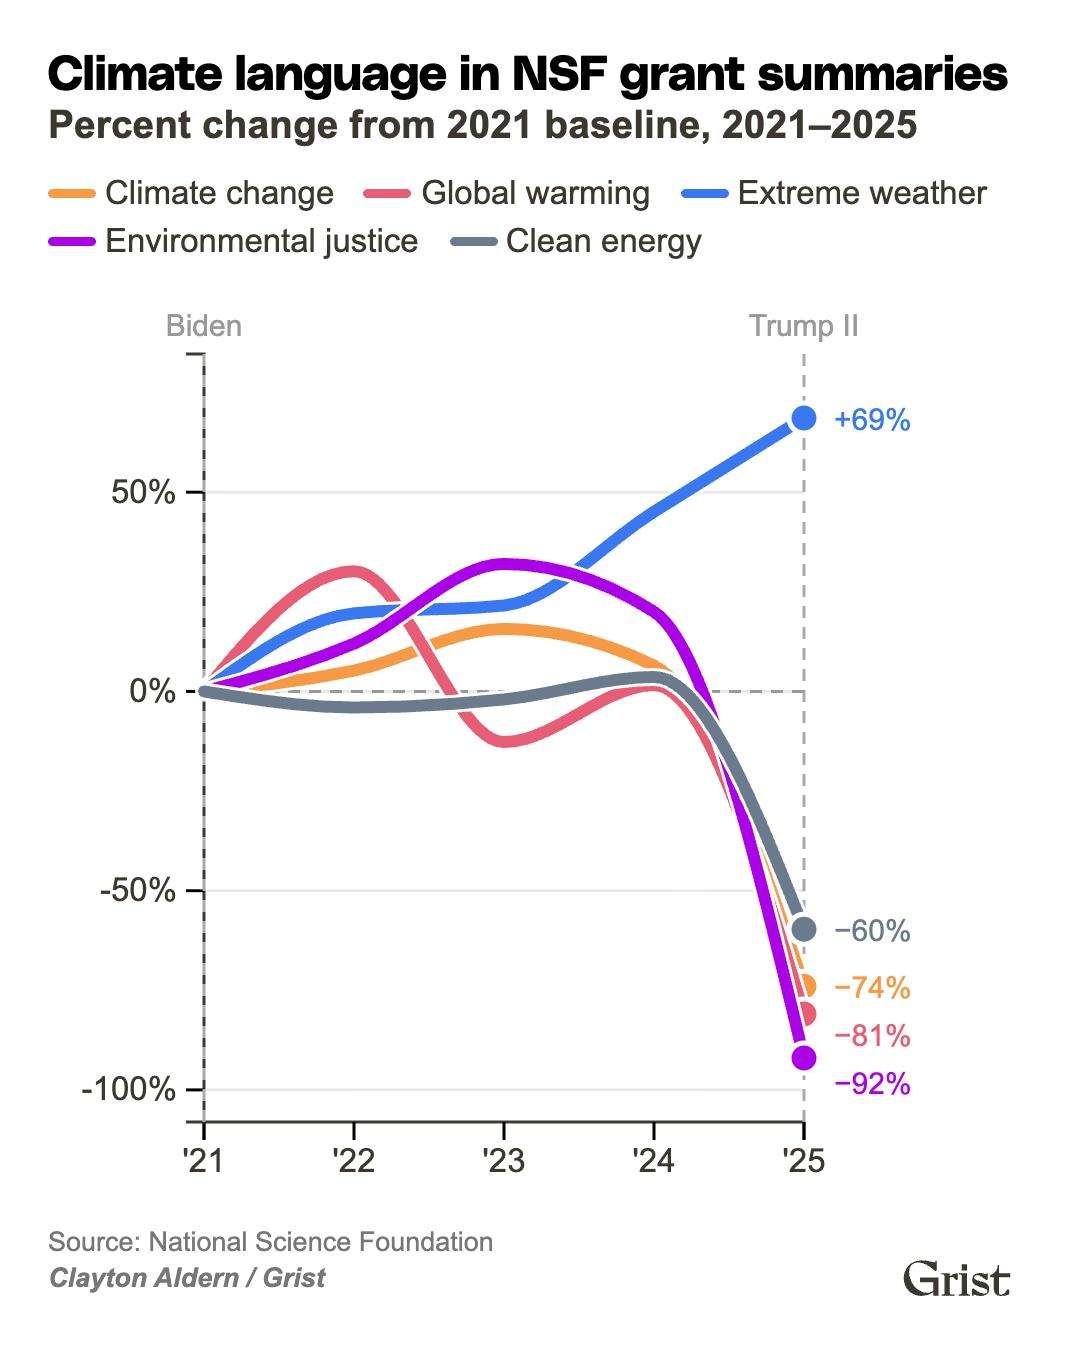
You can see how federally funded research has changed by looking at the grants approved by the National Science Foundation, or NSF, an agency that provides roughly a quarter of the U.S. government’s funding to universities. Grist’s analysis found that the number of NSF grants whose titles or abstracts mentioned “climate change” fell from 889 in 2023 to 148 last year, a 77 percent plunge. Part of that’s a result of NSF staffers approving fewer grants related to climate change under Trump. But researchers self-censoring by omitting the phrase in their proposals also appears to play a role, evidenced by the corresponding rise of “extreme weather” — a synonym that gets around the politicized language.
.nsf-climate-interactive-v2 {
–color-primary: #3c3830;
–color-secondary: #777;
–color-orange: #FCCA1C;
–color-turquoise: #12A07F;
–color-fuchsia: #AC00E8;
–color-bluey: #3977F3;
–color-coral: #E85D75;
–color-slate: #6B7B8D;
–typography-primary: “PolySans”, Arial, sans-serif;
–typography-secondary: “Basis Grotesque”, Arial, sans-serif;
–spacing-base: 10px;
box-sizing: border-box;
font-family: var(–typography-secondary);
margin: 1.5rem auto;
padding: 0;
position: relative;
width: 100%;
}
.nsf-climate-interactive-v2 * { box-sizing: border-box; }
.nsf-climate-interactive-v2 svg text { font-family: var(–typography-secondary); }
.nsf-climate-interactive-v2__title {
font-family: var(–typography-primary);
font-size: 24px;
margin: var(–spacing-base) 0;
}
.nsf-climate-interactive-v2__subtitle {
font-family: var(–typography-secondary);
color: var(–color-primary);
font-size: 18px;
margin: 0 0 var(–spacing-base);
}
.nsf-climate-interactive-v2__controls {
display: flex;
flex-wrap: wrap;
align-items: center;
gap: 16px 24px;
margin-bottom: 12px;
}
.nsf-climate-interactive-v2__toggle {
display: inline-flex;
border: 1.5px solid #ccc;
border-radius: 5px;
overflow: hidden;
}
.nsf-climate-interactive-v2__toggle-btn {
padding: 5px 12px;
font-family: var(–typography-secondary);
font-size: 13px;
background: #fff;
color: var(–color-primary);
border: none;
border-right: 1.5px solid #ccc;
cursor: pointer;
transition: background 0.15s, color 0.15s;
white-space: nowrap;
}
.nsf-climate-interactive-v2__toggle-btn:last-child { border-right: none; }
.nsf-climate-interactive-v2__toggle-btn.active {
background: var(–color-primary);
color: #fff;
}
.nsf-climate-interactive-v2__axis-label {
color: var(–color-primary);
font-size: 14px;
}
.nsf-climate-interactive-v2 .axis-grid line {
stroke: #e0e0e0;
stroke-opacity: 0.7;
shape-rendering: crispEdges;
}
.nsf-climate-interactive-v2 .axis-grid .domain { stroke: none; }
.nsf-climate-interactive-v2 .domain { stroke: #3c3830; }
.nsf-climate-interactive-v2 .line { fill: none; stroke-width: 4px; stroke-linecap: round; stroke-linejoin: round; }
.nsf-climate-interactive-v2 .pulsing-dot { stroke: white; stroke-width: 1.7px; }
.nsf-climate-interactive-v2 .data-label {
font-family: var(–typography-secondary);
font-size: 11px;
fill: var(–color-primary);
paint-order: stroke fill;
stroke: white;
stroke-width: 3px;
stroke-linejoin: round;
stroke-linecap: round;
}
.nsf-climate-interactive-v2 .admin-line {
stroke: #aaa;
stroke-width: 1px;
stroke-dasharray: 4 3;
}
.nsf-climate-interactive-v2 .admin-label {
font-family: var(–typography-secondary);
font-size: 11px;
fill: #999;
text-anchor: middle;
}
.nsf-climate-interactive-v2 .baseline-line {
stroke: #999;
stroke-width: 1px;
stroke-dasharray: 4 3;
}
.nsf-climate-interactive-v2__legend-hint {
font-size: 12px;
color: var(–color-secondary);
font-style: italic;
margin: 0 0 8px;
}
.nsf-climate-interactive-v2__legend {
display: flex;
flex-wrap: wrap;
gap: 6px 16px;
margin-bottom: 8px;
}
.nsf-climate-interactive-v2__legend-item {
display: flex;
align-items: center;
gap: 6px;
font-size: 13px;
color: var(–color-primary);
cursor: pointer;
user-select: none;
transition: opacity 0.2s;
}
.nsf-climate-interactive-v2__legend-item.inactive {
opacity: 0.35;
}
.nsf-climate-interactive-v2__legend-color {
width: 16px;
height: 3px;
border-radius: 2px;
flex-shrink: 0;
}
.nsf-climate-interactive-v2__tooltip {
position: absolute;
padding: 10px;
background: rgba(255, 255, 255, 0.95);
border: 2px solid #888;
border-radius: 4px;
pointer-events: none;
font-size: 12px;
white-space: nowrap;
z-index: 1000;
opacity: 0;
transition: opacity 0.15s;
display: none;
}
.nsf-climate-interactive-v2__tooltip .tt-row {
display: flex;
align-items: center;
gap: 6px;
margin: 2px 0;
}
.nsf-climate-interactive-v2__tooltip .tt-dot {
width: 8px;
height: 8px;
border-radius: 50%;
flex-shrink: 0;
}
.nsf-climate-interactive-v2__tooltip .tt-label {
color: var(–color-primary);
}
.nsf-climate-interactive-v2__tooltip .tt-value {
font-weight: bold;
margin-left: auto;
padding-left: 8px;
}
.nsf-climate-interactive-v2__footer { display: flex; justify-content: space-between; align-items: flex-end; margin-top: 8px; gap: 16px; }
.nsf-climate-interactive-v2__credits { display: flex; flex-direction: column; }
.nsf-climate-interactive-v2__source { color: var(–color-secondary); font-size: 12px; margin-top: 0; display: inline-block; }
.nsf-climate-interactive-v2__credit { color: var(–color-secondary); font-size: 12px; margin-top: 3px; font-style: italic; font-weight: bold; display: inline-block; }
.nsf-climate-interactive-v2__logo { height: auto; max-width: 62px; min-width: 50px; margin-left: auto; padding-right: 20px; margin-right: 0; margin-bottom: 0; transform: translateY(-2px); }
Climate language in NSF grant summaries
Percent change from 2021 baseline, 2021–2025
Click to show or hide lines
Climate change
Global warming
Extreme weather
Environmental justice
Clean energy
(function() {
const INIT_KEY = ‘__grist_nsf_climate_interactive_v2_initialized__’;
if (window[INIT_KEY]) return;
window[INIT_KEY] = true;
const SERIES_CONFIG = [
{ key: ‘Climate change’, color: ‘var(–color-orange)’ },
{ key: ‘Global warming’, color: ‘var(–color-coral)’ },
{ key: ‘Extreme weather’, color: ‘var(–color-bluey)’ },
{ key: ‘Environmental justice’, color: ‘var(–color-fuchsia)’ },
{ key: ‘Clean energy’, color: ‘var(–color-slate)’ }
];
const csvDataPct = `year,Climate change,Global warming,Extreme weather,Environmental justice,Clean energy
2021,6.31,0.63,0.51,0.25,2.48
2022,6.64,0.82,0.61,0.28,2.38
2023,7.30,0.55,0.62,0.33,2.43
2024,6.72,0.64,0.74,0.30,2.57
2025,1.64,0.12,0.86,0.02,1.00`;
function parseCSV(csv) {
return d3.csvParse(csv, d => {
const row = { year: +d.year };
SERIES_CONFIG.forEach(s => { row[s.key] = +d[s.key]; });
return row;
});
}
const rowsPct = parseCSV(csvDataPct);
let mode = ‘change’;
const visibility = {};
SERIES_CONFIG.forEach(s => { visibility[s.key] = true; });
const svgEl = d3.select(‘#nsf-climate-interactive-v2-chart’);
const tooltip = d3.select(‘.nsf-climate-interactive-v2__tooltip’);
const subtitle = d3.select(‘.nsf-climate-interactive-v2__subtitle’);
const transitionDuration = 300;
const ADMINISTRATIONS = [
{ year: 2021, label: ‘Biden’ },
{ year: 2025, label: ‘Trump II’ }
];
let chartGroup, x, y, width, height, margin;
let linePaths = {}, whitePaths = {}, endDots = {}, endLabels = {}, hoverDots = {};
let hoverRect, baselineLine;
let adminLines = {}, adminLabels = {};
function getFilteredRows() {
if (mode === ‘change’) {
const base = rowsPct[0];
return rowsPct.map(d => {
const row = { year: d.year };
SERIES_CONFIG.forEach(s => {
const b = base[s.key];
row[s.key] = b === 0 ? 0 : ((d[s.key] – b) / b) * 100;
});
return row;
});
}
return rowsPct;
}
function getVisibleExtent(rows) {
let min = 0, max = 0;
rows.forEach(row => {
SERIES_CONFIG.forEach(s => {
if (visibility[s.key]) {
if (row[s.key] > max) max = row[s.key];
if (row[s.key] = 0 ? ‘+’ : ”) + d3.format(‘.0f’)(v) + ‘%’;
}
function formatTick(d) {
return d + ‘%’;
}
function updateSubtitle() {
if (mode === ‘share’) {
subtitle.text(‘Share of all grants mentioning each term, 2021u20132025’);
} else {
subtitle.text(‘Percent change from 2021 baseline, 2021u20132025’);
}
}
function initChart() {
svgEl.selectAll(‘*’).remove();
linePaths = {}; whitePaths = {}; endDots = {}; endLabels = {}; hoverDots = {};
const rows = getFilteredRows();
const node = svgEl.node();
const containerWidth = node ? node.getBoundingClientRect().width : 600;
const svgHeight = parseInt(svgEl.attr(‘height’)) || 420;
margin = { top: 20, right: 80, bottom: 36, left: 52 };
width = containerWidth – margin.left – margin.right;
height = svgHeight – margin.top – margin.bottom;
if (width <= 0 || height d.year))
.range([0, width]);
const [yMin, yMax] = getVisibleExtent(rows);
const yPad = (yMax – yMin) * 0.1 || 1;
y = d3.scaleLinear()
.domain([Math.min(0, yMin – yPad), yMax + yPad])
.range([height, 0]);
chartGroup = svgEl.append(‘g’)
.attr(‘transform’, `translate(${margin.left},${margin.top})`);
chartGroup.append(‘g’)
.attr(‘class’, ‘axis-grid y-grid’)
.call(d3.axisLeft(y).ticks(5).tickSize(-width).tickFormat(”));
chartGroup.append(‘g’)
.attr(‘class’, ‘axis x-axis’)
.attr(‘transform’, `translate(0,${height})`)
.call(d3.axisBottom(x)
.tickValues(rows.map(d => d.year))
.tickFormat(d => “‘” + String(d).slice(2)))
.selectAll(‘text’)
.attr(‘class’, ‘nsf-climate-interactive-v2__axis-label’);
chartGroup.append(‘g’)
.attr(‘class’, ‘axis y-axis’)
.call(d3.axisLeft(y).ticks(5).tickFormat(formatTick))
.selectAll(‘text’)
.attr(‘class’, ‘nsf-climate-interactive-v2__axis-label’);
adminLines = {}; adminLabels = {};
ADMINISTRATIONS.forEach(a => {
const xPos = x(a.year);
adminLines[a.year] = chartGroup.append(‘line’)
.attr(‘class’, ‘admin-line’)
.attr(‘x1’, xPos)
.attr(‘x2’, xPos)
.attr(‘y1’, 0)
.attr(‘y2’, height);
adminLabels[a.year] = chartGroup.append(‘text’)
.attr(‘class’, ‘admin-label’)
.attr(‘x’, xPos)
.attr(‘y’, -6)
.text(a.label);
});
baselineLine = chartGroup.append(‘line’)
.attr(‘class’, ‘baseline-line’)
.attr(‘x1’, 0)
.attr(‘x2’, width)
.attr(‘y1’, y(0))
.attr(‘y2’, y(0))
.style(‘opacity’, mode === ‘change’ ? 1 : 0);
const line = d3.line()
.curve(d3.curveMonotoneX)
.x(d => x(d.year))
.y(d => y(d.value));
SERIES_CONFIG.forEach(s => {
const vals = rows.map(r => ({ year: r.year, value: r[s.key] }));
whitePaths[s.key] = chartGroup.append(‘path’)
.datum(vals)
.attr(‘class’, ‘line’)
.attr(‘d’, line)
.style(‘stroke’, ‘white’)
.style(‘stroke-width’, 6)
.style(‘opacity’, visibility[s.key] ? 1 : 0);
linePaths[s.key] = chartGroup.append(‘path’)
.datum(vals)
.attr(‘class’, ‘line’)
.attr(‘d’, line)
.style(‘stroke’, s.color)
.style(‘opacity’, visibility[s.key] ? 1 : 0);
const last = vals[vals.length – 1];
endDots[s.key] = chartGroup.append(‘circle’)
.attr(‘class’, ‘pulsing-dot’)
.attr(‘cx’, x(last.year))
.attr(‘cy’, y(last.value))
.attr(‘r’, 5)
.style(‘fill’, s.color)
.style(‘opacity’, visibility[s.key] ? 1 : 0);
endLabels[s.key] = chartGroup.append(‘text’)
.attr(‘class’, ‘data-label’)
.attr(‘x’, x(last.year) + 10)
.attr(‘y’, y(last.value) + 4)
.attr(‘text-anchor’, ‘start’)
.style(‘fill’, s.key === ‘Climate change’ ? ‘#E2B503’ : s.color)
.text(formatValue(last.value))
.style(‘opacity’, visibility[s.key] ? 1 : 0);
hoverDots[s.key] = chartGroup.append(‘circle’)
.attr(‘r’, 6)
.attr(‘fill’, s.color)
.attr(‘stroke’, ‘white’)
.attr(‘stroke-width’, 2)
.style(‘opacity’, 0)
.style(‘pointer-events’, ‘none’);
});
resolveEndLabels(rows);
hoverRect = chartGroup.append(‘rect’)
.attr(‘width’, width)
.attr(‘height’, height)
.attr(‘fill’, ‘none’)
.attr(‘pointer-events’, ‘all’);
setupHover(rows);
animatePulse();
}
function resolveEndLabels(rows) {
const labels = [];
SERIES_CONFIG.forEach(s => {
if (!visibility[s.key]) return;
const last = rows[rows.length – 1];
const val = last[s.key];
labels.push({ key: s.key, y: y(val), targetY: y(val) + 4, height: 14 });
});
labels.sort((a, b) => a.targetY – b.targetY);
for (let i = 1; i < labels.length; i++) {
const prev = labels[i – 1];
const cur = labels[i];
const minY = prev.targetY + prev.height + 2;
if (cur.targetY {
if (endLabels[lbl.key]) endLabels[lbl.key].attr(‘y’, lbl.targetY);
});
}
function updateChart(animate) {
const rows = getFilteredRows();
const dur = animate ? transitionDuration : 0;
const t = d3.transition().duration(dur).ease(d3.easeCubicInOut);
const [yMin, yMax] = getVisibleExtent(rows);
const yPad = (yMax – yMin) * 0.1 || 1;
y.domain([Math.min(0, yMin – yPad), yMax + yPad]);
x.domain(d3.extent(rows, d => d.year));
const line = d3.line()
.curve(d3.curveMonotoneX)
.x(d => x(d.year))
.y(d => y(d.value));
chartGroup.select(‘.x-axis’)
.transition(t)
.call(d3.axisBottom(x)
.tickValues(rows.map(d => d.year))
.tickFormat(d => “‘” + String(d).slice(2)))
.selectAll(‘text’)
.attr(‘class’, ‘nsf-climate-interactive-v2__axis-label’);
chartGroup.select(‘.y-grid’)
.transition(t)
.call(d3.axisLeft(y).ticks(5).tickSize(-width).tickFormat(”))
.call(g => g.select(‘.domain’).remove());
chartGroup.select(‘.y-axis’)
.transition(t)
.call(d3.axisLeft(y).ticks(5).tickFormat(formatTick))
.selectAll(‘text’)
.attr(‘class’, ‘nsf-climate-interactive-v2__axis-label’);
if (baselineLine) {
baselineLine
.transition(t)
.attr(‘y1’, y(0))
.attr(‘y2’, y(0))
.style(‘opacity’, mode === ‘change’ ? 1 : 0);
}
ADMINISTRATIONS.forEach(a => {
const xPos = x(a.year);
if (adminLines[a.year]) {
adminLines[a.year].transition(t)
.attr(‘x1’, xPos).attr(‘x2’, xPos);
}
if (adminLabels[a.year]) {
adminLabels[a.year].transition(t)
.attr(‘x’, xPos);
}
});
SERIES_CONFIG.forEach(s => {
const vals = rows.map(r => ({ year: r.year, value: r[s.key] }));
const vis = visibility[s.key];
const last = vals[vals.length – 1];
whitePaths[s.key].datum(vals).transition(t).attr(‘d’, line).style(‘opacity’, vis ? 1 : 0);
linePaths[s.key].datum(vals).transition(t).attr(‘d’, line).style(‘opacity’, vis ? 1 : 0);
endDots[s.key].transition(t)
.attr(‘cx’, x(last.year))
.attr(‘cy’, y(last.value))
.style(‘opacity’, vis ? 1 : 0);
endLabels[s.key]
.text(formatValue(last.value))
.transition(t)
.attr(‘x’, x(last.year) + 10)
.style(‘opacity’, vis ? 1 : 0);
});
setTimeout(() => {
const currentRows = getFilteredRows();
SERIES_CONFIG.forEach(s => {
const last = currentRows[currentRows.length – 1];
endLabels[s.key].attr(‘y’, y(last[s.key]) + 4);
});
resolveEndLabels(currentRows);
setupHover(currentRows);
}, dur + 10);
}
function setupHover(rows) {
if (!hoverRect) return;
const bisect = d3.bisector(d => d.year).left;
hoverRect
.on(‘mouseover’, () => {
tooltip.style(‘opacity’, 1).style(‘display’, ‘block’);
SERIES_CONFIG.forEach(s => {
if (visibility[s.key]) hoverDots[s.key].style(‘opacity’, 1);
});
})
.on(‘mousemove’, function(event) {
const [mouseX] = d3.pointer(event, this);
const x0 = x.invert(mouseX);
const i = bisect(rows, x0);
const d0 = rows[Math.max(0, i – 1)];
const d1 = rows[Math.min(rows.length – 1, i)];
const row = (!d0 || !d1) ? (d0 || d1) : (Math.abs(x0 – d0.year) < Math.abs(x0 – d1.year) ? d0 : d1);
if (!row) return;
let html = `
`;
SERIES_CONFIG.forEach(s => {
if (!visibility[s.key]) {
hoverDots[s.key].style(‘opacity’, 0);
return;
}
const val = row[s.key];
hoverDots[s.key]
.attr(‘cx’, x(row.year))
.attr(‘cy’, y(val))
.style(‘opacity’, 1);
html += `
${s.key}
${formatValue(val)}
`;
});
tooltip.html(html);
const wrapper = document.querySelector(‘.nsf-climate-interactive-v2__chart-wrapper’);
const wrapperRect = wrapper.getBoundingClientRect();
const cursorX = event.clientX – wrapperRect.left;
const tooltipWidth = tooltip.node().offsetWidth;
let tooltipX = cursorX > wrapperRect.width / 2
? cursorX – tooltipWidth – 15
: cursorX + 15;
const tooltipY = event.clientY – wrapperRect.top – 28;
tooltip
.style(‘left’, `${tooltipX}px`)
.style(‘top’, `${tooltipY}px`);
})
.on(‘mouseout’, () => {
tooltip.style(‘opacity’, 0).style(‘display’, ‘none’);
SERIES_CONFIG.forEach(s => { hoverDots[s.key].style(‘opacity’, 0); });
});
}
function animatePulse() {
SERIES_CONFIG.forEach(s => {
if (!endDots[s.key]) return;
(function pulse() {
endDots[s.key]
.transition().duration(750).attr(‘r’, 6)
.transition().duration(750).attr(‘r’, 5)
.on(‘end’, pulse);
})();
});
}
document.querySelectorAll(‘.nsf-climate-interactive-v2__toggle-btn’).forEach(btn => {
btn.addEventListener(‘click’, () => {
document.querySelectorAll(‘.nsf-climate-interactive-v2__toggle-btn’).forEach(b => b.classList.remove(‘active’));
btn.classList.add(‘active’);
mode = btn.getAttribute(‘data-mode’);
updateSubtitle();
updateChart(true);
});
});
document.querySelectorAll(‘.nsf-climate-interactive-v2__legend-item’).forEach(item => {
item.addEventListener(‘click’, () => {
const key = item.getAttribute(‘data-toggle’);
visibility[key] = !visibility[key];
item.classList.toggle(‘inactive’, !visibility[key]);
updateChart(true);
});
});
function handleResize() { initChart(); }
if (document.readyState === ‘loading’) {
document.addEventListener(‘DOMContentLoaded’, initChart);
} else {
initChart();
}
window.addEventListener(‘resize’, handleResize);
})();
Trent Ford, the state climatologist for Illinois, says he’s started using terms like “weather extremes” and “weather variability” in framing his proposals for grants.
“It’s sort of a weird thing, because on principle, if we’re studying climate change, to not name climate change feels dirty,” said Ford, who’s also a research scientist at the Illinois State Water Survey at the University of Illinois Urbana-Champaign. But it’s more of a practical decision than anything else: “We’ve seen where grants that say everything but ‘climate change’ and are obviously studying the impacts of climate change get through with no problem.” He only uses the phrase in grant proposals when he thinks it’s absolutely necessary and when efforts to steer around the term would look too obvious to a reviewer.
Researchers have always had to tailor their framing to align with a funder’s priorities, in this case the federal government. Near the end of President Joe Biden’s term in late 2024, when Ford’s team applied for an NSF grant to study how climate conditions could affect Midwestern agriculture, it made sense to include a line about talking to a diverse group of farmers. But that word became a problem after Trump returned to office.
“By the time the proposal got reviewed by the program manager at NSF, that same language that was required four months ago was now actually a death sentence on it,” Ford said. The NSF liked the proposal, but wanted the researchers to remove the line about reaching a diverse set of agricultural stakeholders and confirm that they would talk to “all American farmers,” Ford said. The team sent it back in, and the NSF approved it last April.
Others weren’t so lucky. Another scientist at the USDA’s Agricultural Research Service, who asked to remain anonymous out of fear of retaliation, said DOGE eliminated major research programs at the agency and, in the process, wiped out hundreds of thousands of dollars in federal funds for an initiative to grow plants without soil that “really didn’t have anything to do with climate change.” The scientist said it had only been labeled as climate research to “satisfy the previous Biden administration.”
“Anything, any project, that had ‘CC’ in front of it, was eliminated. Because ‘CC’ stands for climate change,” the staffer said. “So, unfortunately, that came back to bite them during this administration.”
Though not to this extreme, researchers have found themselves staying away from politically fraught terms like “climate change” before. During the first Trump administration, Austin Becker, a professor at the University of Rhode Island who studies how ports and maritime infrastructure can be made more resilient to hazards like storms and flooding, started avoiding the phrase, even though it’s what motivated his research. “Everything that was ‘climate’ just became ‘coastal resilience,’” he said. “And we’ve kind of just stuck with that ever since.”
Ford initially resisted pressure to stop using the phrase from colleagues he was writing grants with, but he gave in this time around for financial reasons. “Getting a grant could be the difference between a graduate student getting a paycheck and us having to let a graduate student go, or having to let a full-time employee of the university go,” he said.
Some researchers have been looking for grants in new places as federal money dries up. Dana Fisher, a professor at American University and the director of its Center for Environment, Community, and Equity, has procured private funding to research ways to improve and expand communication about climate change in North America. She’s also looking overseas for funding, where she’s had success during past Republican administrations that were hesitant to approve grants for climate research. When George W. Bush was president, Fisher got a grant to study how climate action in U.S. cities and states could influence federal policymaking, an effort funded by the Norwegian Research Council — a fact that raised some eyebrows when she mentioned it to people she was interviewing in Congress. “They’re like, huh?” Fisher recalled. “I was like, ‘Well, that’s what happens when there’s a Republican administration.’”
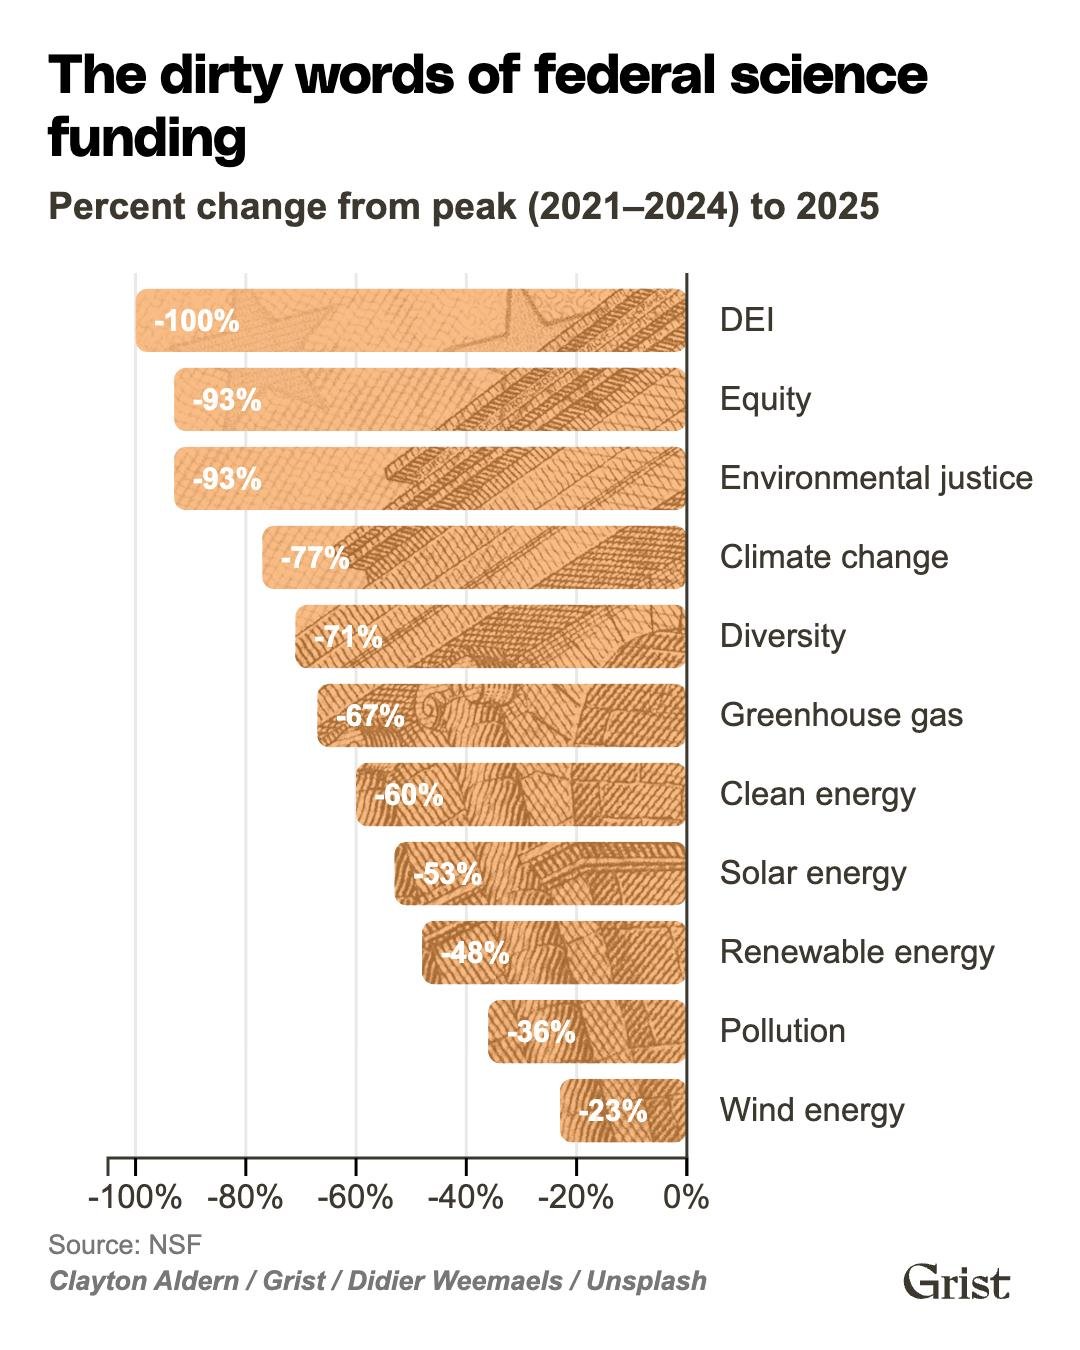
As scarce as funding for anything related to the climate has become under Trump, some topics appear to be even more politically toxic. In Ford’s experience, and from what he’s heard from other researchers, “equity” and “environmental justice” are “actually dirtier words.” The Trump administration has closed the Environmental Protection Agency’s environmental justice offices at its headquarters and in all 10 of its regional offices, and continues to lay off EPA staff who helped communities dealing with pollution. Grist’s analysis of grants reveal a similar pattern: Under Trump, mentions of “DEI” (diversity, equity, and inclusion) have vanished from NSF grants entirely. Terms like “clean energy” and “pollution” have also declined, but not as sharply as climate change.
.nsf-decline-bar {
–color-primary: #3c3830;
–color-secondary: #777;
–color-orange: #FCCA1C;
–color-turquoise: #12A07F;
–typography-primary: “PolySans”, Arial, sans-serif;
–typography-secondary: “Basis Grotesque”, Arial, sans-serif;
–spacing-base: 10px;
box-sizing: border-box;
font-family: var(–typography-secondary);
margin: 1.5rem auto;
padding: 0;
position: relative;
width: 100%;
}
.nsf-decline-bar * { box-sizing: border-box; }
.nsf-decline-bar svg text { font-family: var(–typography-secondary); }
.nsf-decline-bar__title {
font-family: var(–typography-primary);
font-size: 24px;
margin: var(–spacing-base) 0 4px;
text-align: left;
}
.nsf-decline-bar__subtitle {
font-family: var(–typography-secondary);
color: var(–color-primary);
font-size: 18px;
margin: 0;
text-align: left;
}
.nsf-decline-bar__axis-label {
color: var(–color-primary);
font-size: 14px;
}
.nsf-decline-bar .axis-grid line {
stroke: #e0e0e0;
stroke-opacity: 0.7;
shape-rendering: crispEdges;
}
.nsf-decline-bar .axis-grid .domain { stroke: none; }
.nsf-decline-bar .domain { stroke: #3c3830; }
.nsf-decline-bar .bar-label {
font-family: var(–typography-secondary);
font-size: 12px;
fill: var(–color-primary);
paint-order: stroke fill;
stroke: white;
stroke-width: 3px;
stroke-linejoin: round;
stroke-linecap: round;
}
.nsf-decline-bar__footer { display: flex; justify-content: space-between; align-items: flex-end; margin-top: 0px; gap: 16px; }
.nsf-decline-bar__credits { display: flex; flex-direction: column; }
.nsf-decline-bar__source { color: var(–color-secondary); font-size: 12px; margin-top: 0; display: inline-block; }
.nsf-decline-bar__credit { color: var(–color-secondary); font-size: 12px; margin-top: 3px; font-style: italic; font-weight: bold; display: inline-block; }
.nsf-decline-bar__logo { height: auto; max-width: 62px; min-width: 50px; margin-left: auto; padding-right: 20px; margin-right: 0; margin-bottom: 0; transform: translateY(-2px); }
(function() {
const INIT_KEY = ‘__grist_nsf_decline_bar_initialized__’;
if (window[INIT_KEY]) { return; }
window[INIT_KEY] = true;
const COLORS = {
TEXT: ‘#3c3830’,
BAR: ‘#FCCA1C’
};
const BAR_RADIUS = 4;
const svg = d3.select(‘#nsf-decline-bar-horizontal-bar-chart’);
function measureCategoryAxisWidth(svg, categories) {
const TICK_PADDING = 8;
const tempGroup = svg.append(‘g’)
.style(‘visibility’, ‘hidden’);
categories.forEach(cat => {
tempGroup.append(‘text’)
.style(‘font-family’, ‘”Basis Grotesque”, Arial, sans-serif’)
.style(‘font-size’, ’14px’)
.text(cat);
});
let maxWidth = 0;
tempGroup.selectAll(‘text’).each(function() {
const bbox = this.getBBox();
if (bbox.width > maxWidth) maxWidth = bbox.width;
});
tempGroup.remove();
return maxWidth + TICK_PADDING;
}
const rawData = [
{“Term”:”DEI”,”Decline”:-100},
{“Term”:”Equity”,”Decline”:-93},
{“Term”:”Environmental justice”,”Decline”:-93},
{“Term”:”Climate change”,”Decline”:-77},
{“Term”:”Diversity”,”Decline”:-71},
{“Term”:”Greenhouse gas”,”Decline”:-67},
{“Term”:”Clean energy”,”Decline”:-60},
{“Term”:”Solar energy”,”Decline”:-53},
{“Term”:”Renewable energy”,”Decline”:-48},
{“Term”:”Pollution”,”Decline”:-36},
{“Term”:”Wind energy”,”Decline”:-23}
];
const chartData = rawData.map(d => ({
category: d.Term,
value: d.Decline
})).sort((a, b) => a.value – b.value);
function renderChart() {
svg.selectAll(‘*’).remove();
const node = svg.node();
const bboxWidth = node ? node.getBoundingClientRect().width : 0;
const containerWidth = bboxWidth > 0 ? bboxWidth : 600;
const svgHeight = parseInt(svg.attr(‘height’)) || 430;
const baseMargins = { top: 4, right: 20, bottom: 30 };
const categoryLabelWidth = measureCategoryAxisWidth(svg, chartData.map(d => d.category));
const margin = { …baseMargins, left: 20, right: categoryLabelWidth + 16 };
const width = containerWidth – margin.left – margin.right;
const height = svgHeight – margin.top – margin.bottom;
if (width <= 0 || height <= 0) return;
const paddingRatio = 0.2;
const xTickValues = containerWidth d.category))
.range([0, height])
.padding(paddingRatio);
// Grid lines
svg.append(‘g’)
.attr(‘class’, ‘axis-grid’)
.attr(‘transform’, `translate(${margin.left},${margin.top})`)
.call(d3.axisTop(x)
.tickValues(xTickValues)
.tickSize(-height)
.tickFormat(”));
// X axis at bottom
svg.append(‘g’)
.attr(‘transform’, `translate(${margin.left},${height + margin.top})`)
.call(d3.axisBottom(x)
.tickValues(xTickValues)
.tickFormat(d => d + ‘%’))
.selectAll(‘text’)
.attr(‘class’, ‘nsf-decline-bar__axis-label’)
.style(‘fill’, COLORS.TEXT);
// Y axis on right side (at zero line)
const yAxisG = svg.append(‘g’)
.attr(‘transform’, `translate(${margin.left + width},${margin.top})`)
.call(d3.axisRight(y).tickSize(0));
yAxisG.selectAll(‘.tick text’)
.attr(‘class’, ‘nsf-decline-bar__axis-label’)
.style(‘fill’, COLORS.TEXT)
.style(‘text-anchor’, ‘start’)
.attr(‘dx’, ‘8’);
yAxisG.select(‘.domain’).remove();
const chart = svg.append(‘g’).attr(‘transform’, `translate(${margin.left},${margin.top})`);
const defs = chart.append(‘defs’);
// Greyscale filter
const grayFilter = defs.append(‘filter’).attr(‘id’, ‘nsf-decline-bar-greyscale’);
grayFilter.append(‘feColorMatrix’).attr(‘type’, ‘saturate’).attr(‘values’, ‘0’);
// Clip mask for bars — image only shows through bar shapes
const barsMask = defs.append(‘mask’).attr(‘id’, ‘nsf-decline-bar-bars-mask’);
chartData.forEach(d => {
barsMask.append(‘rect’)
.attr(‘x’, x(d.value))
.attr(‘y’, y(d.category))
.attr(‘width’, x(0) – x(d.value))
.attr(‘height’, y.bandwidth())
.attr(‘rx’, BAR_RADIUS)
.attr(‘ry’, BAR_RADIUS)
.attr(‘fill’, ‘white’);
});
// Greyscale image clipped to bar shapes
chart.append(‘image’)
.attr(‘href’, ‘https://grist.org/wp-content/uploads/2026/03/banknote-didier-weemaels.jpg’)
.attr(‘x’, 0).attr(‘y’, 0)
.attr(‘width’, width).attr(‘height’, height)
.attr(‘preserveAspectRatio’, ‘xMidYMid slice’)
.attr(‘mask’, ‘url(#nsf-decline-bar-bars-mask)’)
.attr(‘filter’, ‘url(#nsf-decline-bar-greyscale)’);
// Color overlay bars at 65% opacity
chart.selectAll(‘.bar’)
.data(chartData)
.enter().append(‘rect’)
.attr(‘class’, ‘bar’)
.attr(‘x’, d => x(d.value))
.attr(‘y’, d => y(d.category))
.attr(‘width’, d => x(0) – x(d.value))
.attr(‘height’, y.bandwidth())
.attr(‘rx’, BAR_RADIUS)
.attr(‘ry’, BAR_RADIUS)
.style(‘fill’, COLORS.BAR)
.style(‘opacity’, 0.65);
// Zero line
chart.append(‘line’)
.attr(‘x1’, x(0)).attr(‘y1’, 0)
.attr(‘x2’, x(0)).attr(‘y2’, height)
.attr(‘stroke’, ‘#3c3830’).attr(‘stroke-width’, 1);
// Labels inside bars
chart.selectAll(‘.bar-label’)
.data(chartData)
.enter().append(‘text’)
.attr(‘class’, ‘bar-label’)
.attr(‘x’, d => x(d.value) + 6)
.attr(‘y’, d => y(d.category) + y.bandwidth() / 2)
.attr(‘dy’, ‘0.35em’)
.attr(‘text-anchor’, ‘start’)
.text(d => d.value + ‘%’)
.style(‘fill’, ‘#3c3830’)
.style(‘font-weight’, ‘bold’);
}
if (document.readyState === ‘loading’) {
document.addEventListener(‘DOMContentLoaded’, renderChart);
} else {
renderChart();
}
window.addEventListener(‘resize’, renderChart);
})();
You could view the federal government’s pressure on scientists to change their language in different ways. Is it Orwellian-style censorship, silencing dissent and policing language? Or simply the right of a funder, whose politics changes with each administration, to ask for research that reflects its concerns? Does it affect what research gets done, or simply swap in harmless synonyms to ensure the work can continue?
The answer is complicated, according to the USDA’s Roberts. Many of the climate projects at the agency’s research division that have so far avoided cancellation are stuck in funding purgatory, awaiting a fate that could hinge on a politically charged word or two. Scientists are adapting their research to better align with White House priorities, hoping to continue equipping farmers with the knowledge of how to adapt to a warming world — and scrubbing any forbidden language in the meantime.
“Clever word usage, and controlling the scope of how the research is presented, allows for scientists to keep doing the work,” Roberts said. “There’s no one going around hunting these people down, thankfully. Not yet, anyway.”
A list of words related to climate and the environment included in the leaked USDA ARS banned words memo
toolTips(‘.classtoolTips7′,’A powerful greenhouse gas that accounts for about 11% of global emissions, methane is the primary component of natural gas and is emitted into the atmosphere by landfills, oil and natural gas systems, agricultural activities, coal mining, and wastewater treatment, among other pathways. Over a 20-year period, it is roughly 84 times more potent than carbon dioxide at trapping heat in the atmosphere.‘); toolTips(‘.classtoolTips12’,’An acronym for per- and polyfluoroalkyl substances, PFAS are a class of chemicals used in everyday items like nonstick cookware, cosmetics, and food packaging that have proven to be dangerous to human health. Also called “forever chemicals” for their inability to break down over time, PFAS can be found lingering nearly everywhere — in water, soil, air, and the blood of people and animals.
‘);
This story was originally published by Grist with the headline To keep climate science alive, researchers are speaking in code on Mar 27, 2026.


