China’s Debt Surpasses Europe for the First Time
See visuals like this from many other data creators on our Voronoi app. Download it for free on iOS or Android and discover incredible data-driven charts from a variety of trusted sources.
Key Takeaways
- China’s government debt reached $18.7T in 2025, surpassing the EU for the first time.
- U.S. debt climbed to $38.3T, remaining the world’s largest by a wide margin.
- Since 2008, China’s debt has grown more than twice as fast as the U.S. and far faster than Europe.
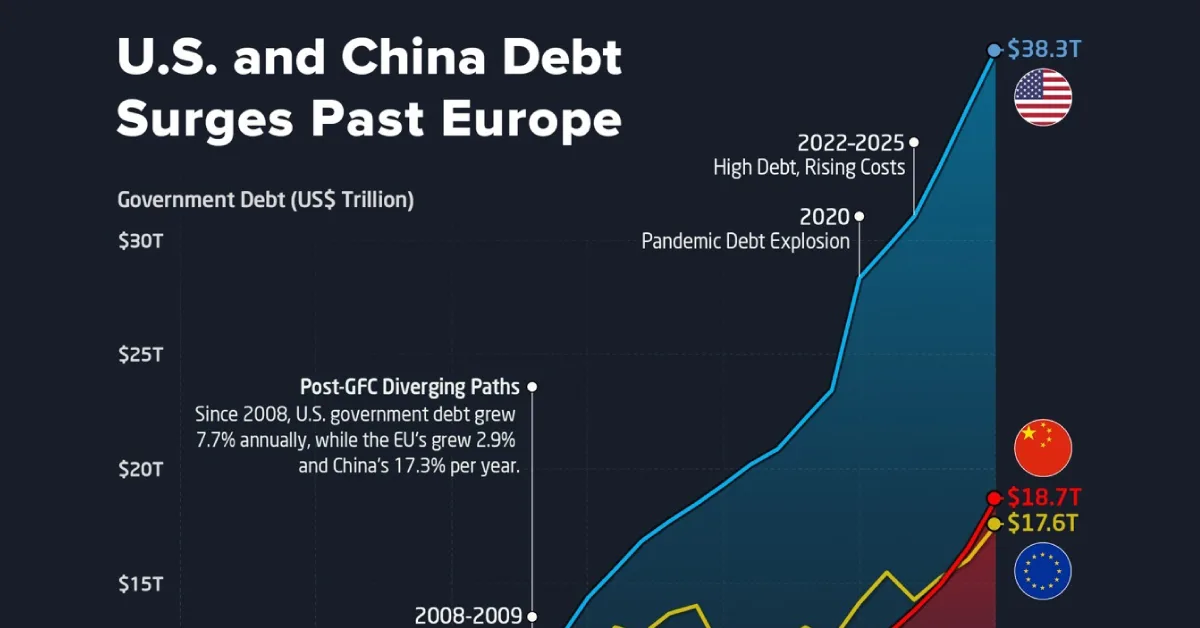
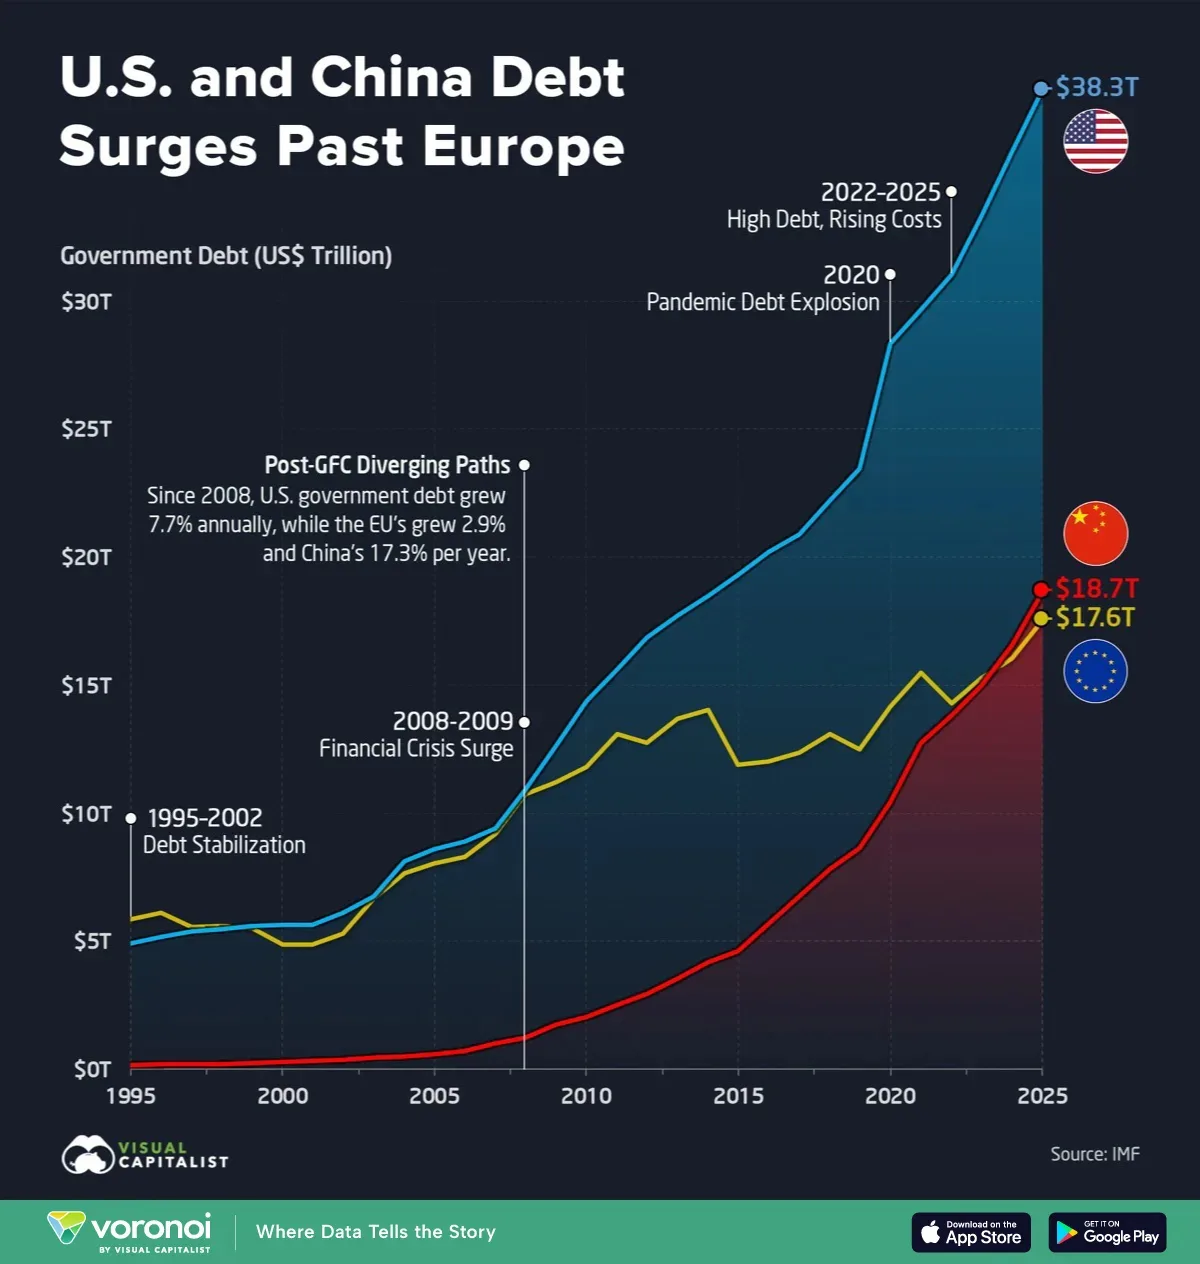
China’s government debt has surpassed the European Union’s for the first time, marking a major shift in the global debt landscape.
Since the 2008 financial crisis, the U.S., China, and Europe have followed very different borrowing paths. While Europe kept debt growth relatively constrained, both the U.S. and China expanded rapidly—especially after 2020.
The chart visualizes annual government debt totals for the U.S., EU, and China from 1995 to 2025 in current U.S. dollars (not adjusted for inflation), using data from the IMF.
In 2025, China’s government debt reached $18.7 trillion, surpassing the EU’s $17.6 trillion total for the first time. The crossover underscores how rapidly China’s borrowing has scaled over the past two decades.
The Rapid Rise in U.S. and China’s Government Debt
In 2008, U.S. government debt stood at $10.9 trillion, roughly in line with the EU’s $10.7 trillion total. By 2025, it had surged to $38.3 trillion, leaving the EU behind by $20.7 trillion.
The data table below shows the government debt of the U.S., China, and EU from 1995 to 2025 in current U.S. dollars:
| Year |  U.S. Government Debt (trillions, USD) U.S. Government Debt (trillions, USD) |
 EU Government Debt (trillions, USD) EU Government Debt (trillions, USD) |
 China Government Debt (trillions, USD) China Government Debt (trillions, USD) |
|---|---|---|---|
| 1995 | 4.9 | 5.9 | 0.2 |
| 1996 | 5.2 | 6.1 | 0.2 |
| 1997 | 5.4 | 5.6 | 0.2 |
| 1998 | 5.5 | 5.6 | 0.2 |
| 1999 | 5.6 | 5.5 | 0.2 |
| 2000 | 5.6 | 4.9 | 0.3 |
| 2001 | 5.7 | 4.9 | 0.3 |
| 2002 | 6.1 | 5.3 | 0.4 |
| 2003 | 6.8 | 6.7 | 0.4 |
| 2004 | 8.1 | 7.7 | 0.5 |
| 2005 | 8.6 | 8 | 0.6 |
| 2006 | 8.9 | 8.3 | 0.7 |
| 2007 | 9.4 | 9.2 | 1 |
| 2008 | 10.9 | 10.7 | 1.2 |
| 2009 | 12.6 | 11.2 | 1.8 |
| 2010 | 14.4 | 11.8 | 2 |
| 2011 | 15.6 | 13.1 | 2.5 |
| 2012 | 16.9 | 12.8 | 2.9 |
| 2013 | 17.7 | 13.7 | 3.6 |
| 2014 | 18.5 | 14 | 4.2 |
| 2015 | 19.3 | 11.9 | 4.6 |
| 2016 | 20.2 | 12 | 5.7 |
| 2017 | 20.9 | 12.4 | 6.7 |
| 2018 | 22.2 | 13.1 | 7.8 |
| 2019 | 23.4 | 12.5 | 8.7 |
| 2020 | 28.3 | 14.1 | 10.4 |
| 2021 | 29.7 | 15.5 | 12.8 |
| 2022 | 31 | 14.3 | 13.8 |
| 2023 | 33.3 | 15.3 | 15 |
| 2024 | 35.8 | 16 | 16.6 |
| 2025 | 38.3 | 17.6 | 18.7 |
From just $1.2 trillion in 2008, China’s government debt grew at roughly 17% annually—fast enough to overtake the EU in less than two decades.
Since 2008, U.S. government debt expanded at about 7.7% per year, compared with roughly 3.0% per year for the EU.
Why China and U.S. Debt Grew Much Faster than Europe’s
While the EU’s slower debt growth partially reflects weaker nominal growth across the bloc compared to the U.S. and China, it also is a symptom of the bloc’s tighter fiscal constraints after Europe’s sovereign debt crisis, which peaked between 2010 and 2012.
In contrast, China’s surge in debt was driven by credit expansion, infrastructure spending, and state-backed growth.
The U.S., meanwhile, combined crisis-era borrowing with persistent deficits, especially after 2020, allowing debt to scale far beyond Europe’s. With fewer fiscal constraints at the federal level, Washington has maintained higher spending levels—helping explain why U.S. debt now stands far above both China and the EU.
Learn More on the Voronoi App 
If you enjoyed today’s post, check out The World’s $111 Trillion in Government Debt on Voronoi.