Mapped: Population Growth in Every Country (2000–2025)
See visuals like this from many other data creators on our Voronoi app. Download it for free on iOS or Android and discover incredible data-driven charts from a variety of trusted sources.
Key Takeaways
- A small group of countries saw explosive population growth, led by Qatar with an increase of over 400% since 2000.
- Most countries grew, but nearly 1 in 7 experienced population decline.
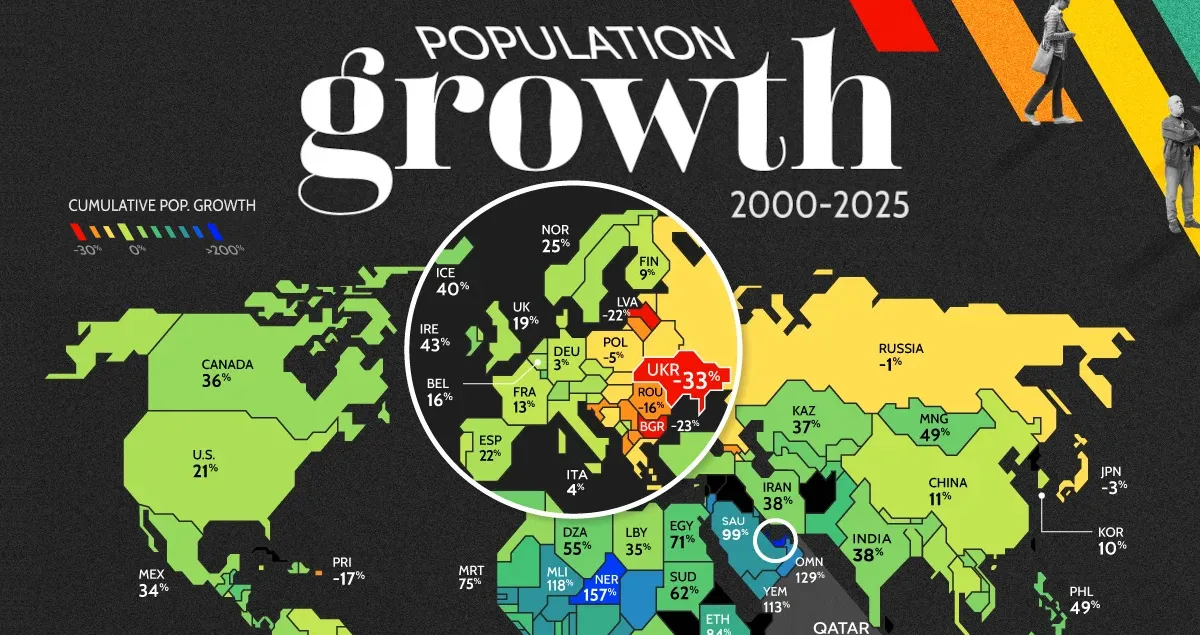
- The sharpest declines were concentrated in Eastern Europe, led by Ukraine at -32.5%.
Over the past 25 years, population trends have split in two directions. Some countries have seen their populations multiply several times over, while others have steadily declined.
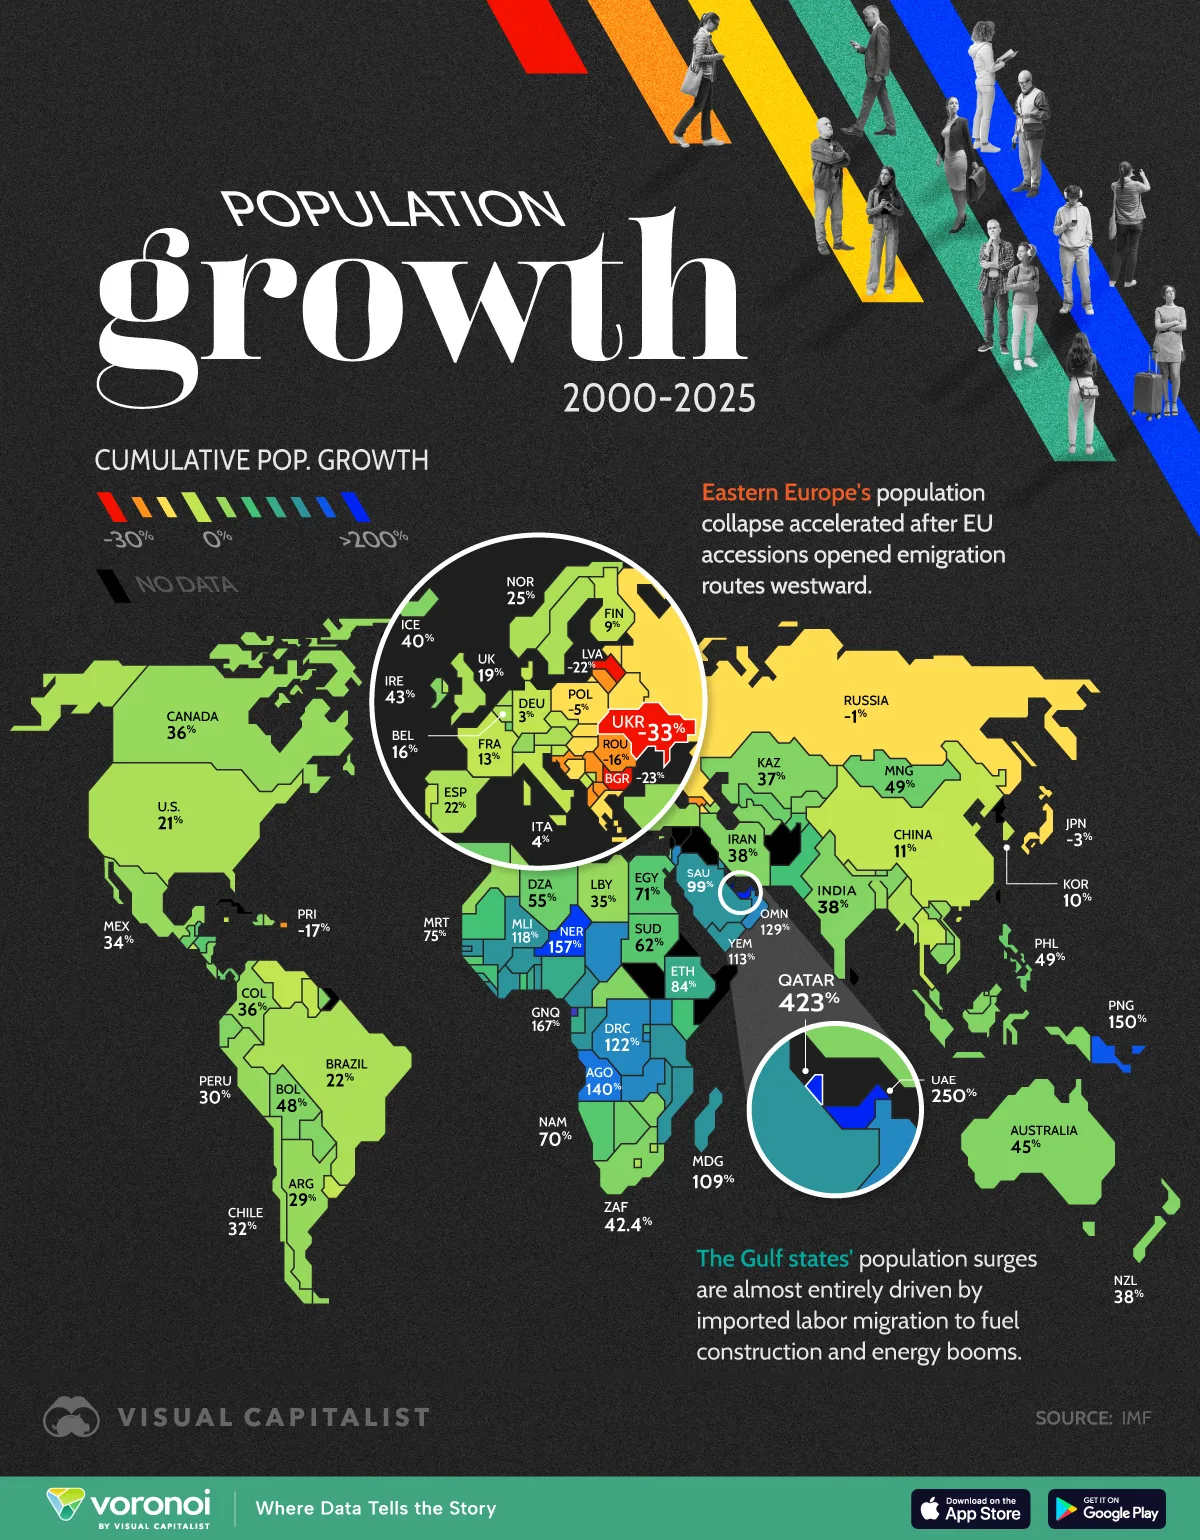
This map shows cumulative population change by country from 2000 to 2025, based on data from the IMF. The contrast is clear: migration-driven growth in parts of the Gulf and Africa, and sustained population decline across Eastern Europe.
Where Population Growth is Surging
The fastest-growing populations are concentrated in a relatively small group of countries, mainly in the Gulf and sub-Saharan Africa, where migration and demographic momentum have driven rapid expansion.
The data table below shows the cumulative population change of each country from 2000 to 2025:
| Rank | Country | Population Change 2000–2025 (%) |
|---|---|---|
| 1 |  Qatar Qatar |
423.4 |
| 2 |  United Arab Emirates United Arab Emirates |
249.7 |
| 3 |  Equatorial Guinea Equatorial Guinea |
166.6 |
| 4 |  Niger Niger |
157.0 |
| 5 |  Bahrain Bahrain |
153.9 |
| 6 |  Papua New Guinea Papua New Guinea |
149.6 |
| 7 |  Angola Angola |
139.7 |
| 8 |  Kuwait Kuwait |
139.1 |
| 9 |  Oman Oman |
129.1 |
| 10 |  Chad Chad |
126.9 |
| 11 |  Jordan Jordan |
126.3 |
| 12 |  Burundi Burundi |
123.6 |
| 13 |  Democratic Republic of the Congo Democratic Republic of the Congo |
121.8 |
| 14 |  Uganda Uganda |
120.1 |
| 15 |  Zambia Zambia |
119.5 |
| 16 |  Mali Mali |
118.4 |
| 17 |  Yemen Yemen |
112.9 |
| 18 |  Gambia, The Gambia, The |
112.8 |
| 19 |  Madagascar Madagascar |
108.7 |
| 20 |  Benin Benin |
106.6 |
| 21 |  Republic of Congo Republic of Congo |
107.0 |
| 22 |  Tanzania Tanzania |
106.4 |
| 23 |  Mozambique Mozambique |
102.3 |
| 24 |  Côte d’Ivoire Côte d’Ivoire |
102.3 |
| 25 |  Burkina Faso Burkina Faso |
102.0 |
| 26 |  Liberia Liberia |
101.2 |
| 27 |  Cameroon Cameroon |
100.4 |
| 28 |  Malawi Malawi |
99.3 |
| 29 |  Saudi Arabia Saudi Arabia |
98.5 |
| 30 |  Timor-Leste Timor-Leste |
97.5 |
| 31 |  Senegal Senegal |
95.7 |
| 32 |  Sierra Leone Sierra Leone |
92.4 |
| 33 |  Gabon Gabon |
91.4 |
| 34 |  Nigeria Nigeria |
90.2 |
| 35 |  Togo Togo |
90.3 |
| 36 |  Solomon Islands Solomon Islands |
88.7 |
| 37 |  Vanuatu Vanuatu |
86.9 |
| 38 |  Rwanda Rwanda |
83.9 |
| 39 |  Ethiopia Ethiopia |
83.5 |
| 40 |  Kenya Kenya |
80.9 |
| 41 |  Guinea Guinea |
80.7 |
| 42 |  Ghana Ghana |
78.6 |
| 43 |  Pakistan Pakistan |
77.4 |
| 44 |  Mauritania Mauritania |
75.1 |
| 45 |  Egypt Egypt |
71.0 |
| 46 |  Namibia Namibia |
69.6 |
| 47 |  Comoros Comoros |
69.5 |
| 48 |  Guinea-Bissau Guinea-Bissau |
69.1 |
| 49 |  Belize Belize |
66.8 |
| 50 |  Tajikistan Tajikistan |
66.7 |
| 51 |  São Tomé and Príncipe São Tomé and Príncipe |
66.7 |
| 52 |  Honduras Honduras |
65.0 |
| 53 |  Sudan Sudan |
62.1 |
| 54 |  Israel Israel |
61.9 |
| 55 |  Botswana Botswana |
60.0 |
| 56 |  Guatemala Guatemala |
59.5 |
| 57 |  Luxembourg Luxembourg |
57.8 |
| 58 |  Algeria Algeria |
54.9 |
| 59 |  Uzbekistan Uzbekistan |
54.0 |
| 60 |  Kiribati Kiribati |
53.6 |
| 61 |  Maldives Maldives |
52.2 |
| 62 |  Singapore Singapore |
50.9 |
| 63 |  Panama Panama |
50.1 |
| 64 |  Mongolia Mongolia |
49.1 |
| 65 |  Philippines Philippines |
48.6 |
| 66 |  Zimbabwe Zimbabwe |
48.5 |
| 67 |  Kyrgyz Republic Kyrgyz Republic |
48.2 |
| 68 |  Bolivia Bolivia |
47.7 |
| 69 |  Djibouti Djibouti |
47.1 |
| 70 |  Cambodia Cambodia |
46.6 |
| 71 |  Haiti Haiti |
46.4 |
| 72 |  Central African Republic Central African Republic |
45.8 |
| 73 |  Australia Australia |
44.9 |
| 74 |  Ecuador Ecuador |
45.1 |
| 75 |  Malta Malta |
44.7 |
| 76 |  Malaysia Malaysia |
44.1 |
| 77 |  Lao P.D.R. Lao P.D.R. |
43.4 |
| 78 |  Ireland Ireland |
43.4 |
| 79 |  South Africa South Africa |
42.4 |
| 80 |  Turkmenistan Turkmenistan |
42.5 |
| 81 |  Brunei Darussalam Brunei Darussalam |
41.5 |
| 82 |  Nicaragua Nicaragua |
41.4 |
| 83 |  Costa Rica Costa Rica |
41.0 |
| 84 |  Suriname Suriname |
40.7 |
| 85 |  Iceland Iceland |
40.1 |
| 86 |  India India |
38.4 |
| 87 |  Paraguay Paraguay |
38.0 |
| 88 |  Bhutan Bhutan |
38.0 |
| 89 |  Antigua and Barbuda Antigua and Barbuda |
38.2 |
| 90 |  Indonesia Indonesia |
37.9 |
| 91 |  Iran Iran |
37.8 |
| 92 |  New Zealand New Zealand |
37.9 |
| 93 |  Kazakhstan Kazakhstan |
36.9 |
| 94 |  Cyprus Cyprus |
36.5 |
| 95 |  Bangladesh Bangladesh |
36.1 |
| 96 |  Colombia Colombia |
35.7 |
| 97 |  Canada Canada |
35.6 |
| 98 |  Bahamas, The Bahamas, The |
35.9 |
| 99 |  Libya Libya |
34.8 |
| 100 |  Mexico Mexico |
34.2 |
| 101 |  Türkiye, Republic of Türkiye, Republic of |
33.9 |
| 102 |  Morocco Morocco |
32.5 |
| 103 |  Chile Chile |
31.7 |
| 104 |  Peru Peru |
30.4 |
| 105 |  Argentina Argentina |
29.4 |
| 106 |  Dominican Republic Dominican Republic |
29.6 |
| 107 |  Azerbaijan Azerbaijan |
29.1 |
| 108 |  Vietnam Vietnam |
28.7 |
| 109 |  Tunisia Tunisia |
28.2 |
| 110 |  Switzerland Switzerland |
26.0 |
| 111 |  Seychelles Seychelles |
25.9 |
| 112 |  Norway Norway |
25.0 |
| 113 |  Cabo Verde Cabo Verde |
24.2 |
| 114 |  Liechtenstein Liechtenstein |
24.2 |
| 115 |  Spain Spain |
22.3 |
| 116 |  Brazil Brazil |
22.1 |
| 117 |  Samoa Samoa |
21.8 |
| 118 |  Eswatini Eswatini |
21.5 |
| 119 |  United States United States |
21.0 |
| 120 |  Nepal Nepal |
20.8 |
| 121 |  Sweden Sweden |
20.2 |
| 122 |  Myanmar Myanmar |
19.5 |
| 123 |  Lesotho Lesotho |
19.4 |
| 124 |  United Kingdom United Kingdom |
18.6 |
| 125 |  Belgium Belgium |
15.9 |
| 126 |  Fiji Fiji |
15.7 |
| 127 |  Saint Kitts and Nevis Saint Kitts and Nevis |
15.6 |
| 128 |  Austria Austria |
14.6 |
| 129 |  Saint Lucia Saint Lucia |
14.5 |
| 130 |  Netherlands Netherlands |
13.8 |
| 131 |  France France |
13.4 |
| 132 |  Trinidad and Tobago Trinidad and Tobago |
13.3 |
| 133 |  Denmark Denmark |
12.6 |
| 134 |  Grenada Grenada |
12.6 |
| 135 |  Hong Kong SAR Hong Kong SAR |
12.2 |
| 136 |  Thailand Thailand |
11.7 |
| 137 |  China China |
10.9 |
| 138 |  South Korea South Korea |
9.9 |
| 139 |  Venezuela Venezuela |
9.3 |
| 140 |  Finland Finland |
8.5 |
| 141 |  Barbados Barbados |
8.1 |
| 142 |  Guyana Guyana |
7.7 |
| 143 |  El Salvador El Salvador |
7.2 |
| 144 |  Slovenia Slovenia |
7.2 |
| 145 |  Kosovo Kosovo |
7.1 |
| 146 |  Aruba Aruba |
6.9 |
| 147 |  Jamaica Jamaica |
6.6 |
| 148 |  Czechia Czechia |
6.1 |
| 149 |  Mauritius Mauritius |
5.8 |
| 150 |  Dominica Dominica |
5.6 |
| 151 |  Taiwan Province of China Taiwan Province of China |
5.0 |
| 152 |  Portugal Portugal |
4.5 |
| 153 |  Uruguay Uruguay |
4.1 |
| 154 |  Italy Italy |
3.5 |
| 155 |  Montenegro Montenegro |
3.1 |
| 156 |  Saint Vincent and the Grenadines Saint Vincent and the Grenadines |
2.8 |
| 157 |  Germany Germany |
2.7 |
| 158 |  Slovak Republic Slovak Republic |
0.4 |
| 159 |  Tonga Tonga |
0.0 |
| 160 |  Russia Russia |
-0.7 |
| 161 |  Estonia Estonia |
-1.6 |
| 162 |  Japan Japan |
-2.8 |
| 163 |  Armenia Armenia |
-3.3 |
| 164 |  Greece Greece |
-3.7 |
| 165 |  Poland Poland |
-4.6 |
| 166 |  Palau Palau |
-5.3 |
| 167 |  Hungary Hungary |
-6.5 |
| 168 |  Bosnia and Herzegovina Bosnia and Herzegovina |
-8.2 |
| 169 |  Belarus Belarus |
-9.0 |
| 170 |  North Macedonia North Macedonia |
-10.0 |
| 171 |  Georgia Georgia |
-10.3 |
| 172 |  Micronesia Micronesia |
-11.2 |
| 173 |  Croatia Croatia |
-12.0 |
| 174 |  Albania Albania |
-12.8 |
| 175 |  Serbia Serbia |
-13.1 |
| 176 |  Romania Romania |
-16.1 |
| 177 |  Puerto Rico Puerto Rico |
-16.7 |
| 178 |  Lithuania Lithuania |
-17.5 |
| 179 |  Moldova Moldova |
-18.8 |
| 180 |  Latvia Latvia |
-21.6 |
| 181 |  Bulgaria Bulgaria |
-23.2 |
| 182 |  Marshall Islands Marshall Islands |
-29.4 |
| 183 |  Ukraine Ukraine |
-32.5 |
Qatar stands far ahead of every other country, with its population increasing more than fivefold (+423.4%) since 2000. This surge has been driven largely by an influx of foreign workers tied to energy and infrastructure booms. Other Gulf economies also rank among the fastest-growing, including the United Arab Emirates (+249.7%), Bahrain (+153.9%), Kuwait (+139.1%), Oman (+129.1%), and Saudi Arabia (+98.5%).
Outside the Gulf, several African economies also posted strong gains, including Equatorial Guinea (+166.6%), Niger (+157.0%), Angola (+139.7%), and Chad (+126.9%).
At the opposite extreme, several countries are shrinking rapidly. Ukraine leads the declines at -32.5%, followed by a cluster of Eastern European and Baltic states, including Bulgaria (-23.2%), Latvia (-21.6%), Lithuania (-17.5%), Moldova (-18.8%), and Romania (-16.1%).
EU accession opened westward migration routes for parts of Eastern Europe, accelerating long-term population losses in a region already facing aging demographics and low birth rates.
Large Economies Saw More Moderate Growth
Among the world’s largest economies, population growth was generally more moderate. India grew 38.4%, while the U.S. rose 21.0%, China 10.9%, and Brazil 22.1%. Canada posted a stronger 35.6% increase, and Australia climbed 44.9%.
Elsewhere in Asia, Japan declined 2.8% and South Korea rose 9.9%, both trailing the global average increase of 46.6%.
Taken together, the map shows that the fastest population expansion has not been driven by the largest economies, but by a mix of migration-heavy Gulf states and younger, faster-growing developing countries.
Learn More on the Voronoi App 
If you enjoyed today’s post, check out Europe’s Population May Fall by 150 Million People by 2100 on Voronoi.