Ranked: The 10 Countries That Control Global Trade
See visuals like this from many other data creators on our Voronoi app. Download it for free on iOS or Android and discover incredible data-driven charts from a variety of trusted sources.
Key Takeaways
- China and the U.S. dominate both global imports and exports by total trade value.
- Germany ranks third in imports and exports, reinforcing its role as Europe’s manufacturing powerhouse.
- Trade hubs like the Netherlands and Hong Kong punch far above their size in global commerce.
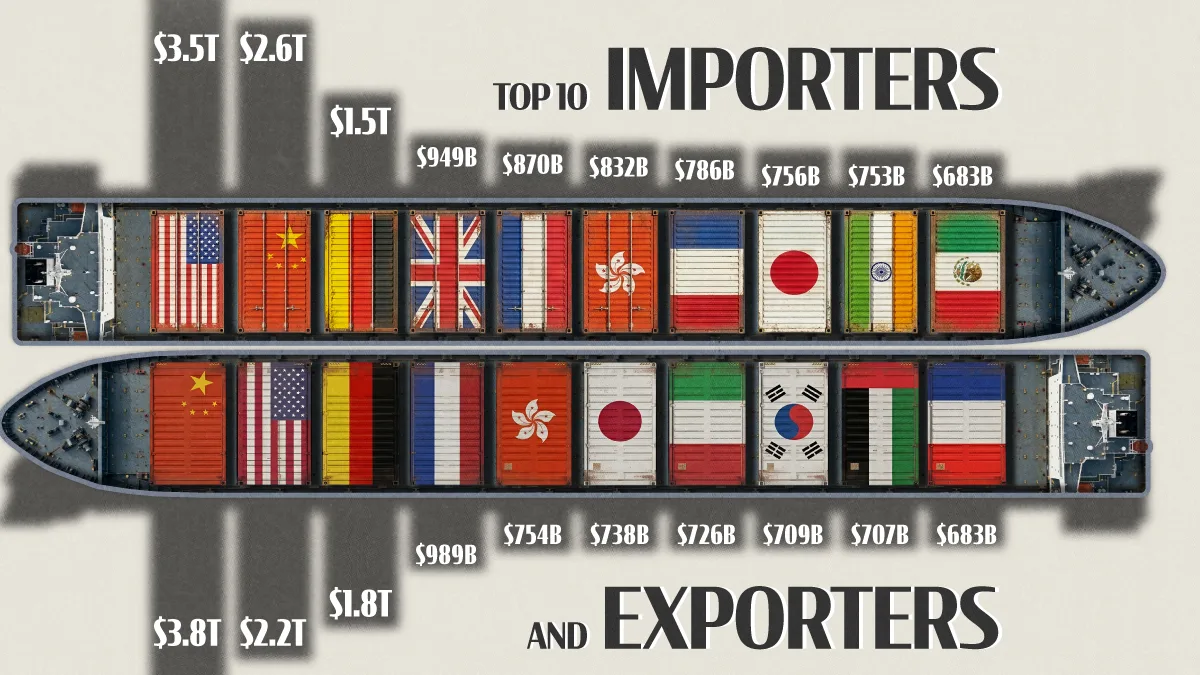
This visualization ranks the world’s largest importers and exporters by merchandise trade value in 2025, using data from the World Trade Organization.
China and the U.S. sit at the center of global trade flows, dominating both the buying and selling of goods worldwide. Together with Germany, they account for a massive share of global merchandise trade.
The rankings also highlight how interconnected modern supply chains have become, with many countries importing raw materials and components before exporting finished products for global markets.
The U.S. Leads Global Imports
The United States was the world’s largest importer in 2025, bringing in $3.5 trillion worth of goods.
The country remains a major driver of global consumer demand, importing massive volumes of electronics, vehicles, machinery, clothing, and industrial goods from trading partners around the world.
| Rank | Importer | Value ($) | Change (vs. 2024) |
|---|---|---|---|
| 1 |  United States United States |
3.5T | 4% |
| 2 |  China China |
2.6T | 0% |
| 3 |  Germany Germany |
1.5T | 9% |
| 4 |  United Kingdom United Kingdom |
949B | 16% |
| 5 |  Netherlands Netherlands |
870B | 7% |
| 6 |  Hong Kong Hong Kong |
832B | 18% |
| 7 |  France France |
786B | 5% |
| 8 |  Japan Japan |
756B | 2% |
| 9 |  India India |
753B | 5% |
| 10 |  Mexico Mexico |
683B | 4% |
China ranked second with $2.6 trillion in imports, followed by Germany at $1.5 trillion.
China Remains the Export Leader
China ranked as the world’s largest exporter, shipping $3.8 trillion worth of goods in 2025.
China’s export dominance is powered by its vast manufacturing base, which supplies everything from consumer electronics to industrial machinery for markets worldwide.
| Rank | Exporter | Value ($) | Change (vs. 2024) |
|---|---|---|---|
| 1 | China |
3.8T | 5% |
| 2 | United States |
2.2T | 6% |
| 3 | Germany |
1.8T | 5% |
| 4 | Netherlands |
989B | 7% |
| 5 | Hong Kong |
754B | 17% |
| 6 | Japan |
738B | 4% |
| 7 |  Italy Italy |
726B | 8% |
| 8 |  South Korea South Korea |
709B | 4% |
| 9 |  United Arab Emirates United Arab Emirates |
707B | 17% |
| 10 | France |
683B | 7% |
The United States ranked second with $2.2 trillion in exports, while Germany placed third at $1.8 trillion.
Many of the world’s top exporters are also among its largest importers. Modern supply chains depend on countries importing raw materials, components, and intermediate goods before exporting finished products to global markets.
Trade Hubs Play an Outsized Role
Smaller economies such as the Netherlands and Hong Kong ranked highly on both the import and export lists.
The Netherlands benefits from its role as a gateway to Europe, supported by major ports and logistics infrastructure.
Hong Kong remains closely tied to mainland China, with more than 40% of its exports going there.
The United Arab Emirates also stood out, ranking ninth among exporters with $707 billion in merchandise exports. Its position reflects its role as both an energy exporter and a regional trade hub connecting Asia, Europe, and Africa.
Learn More on the Voronoi App 
If you enjoyed today’s post, check out Mapping America’s $1.24 Trillion Trade Deficit on Voronoi, the new app from Visual Capitalist.