Mapped: Where Electricity Prices Jumped the Most in America
See visuals like this from many other data creators on our Voronoi app. Download it for free on iOS or Android and discover incredible data-driven charts from a variety of trusted sources.
Key Takeaways
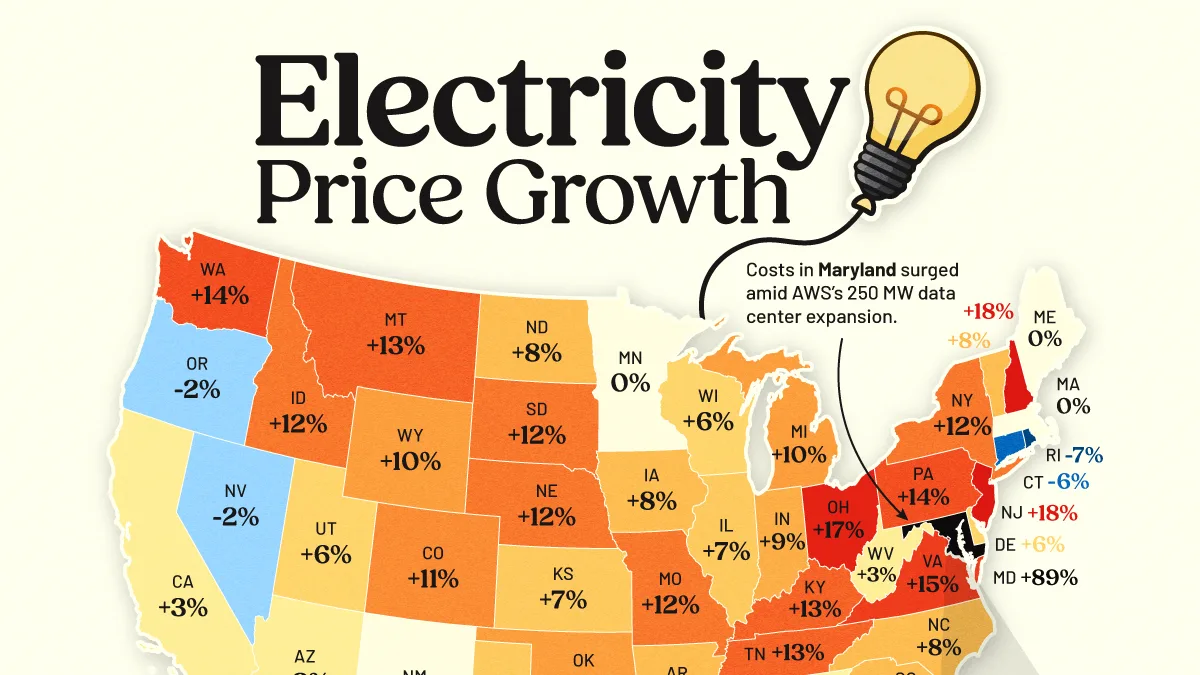
- Maryland recorded the largest increase in residential electricity prices nationwide, with costs jumping 89% over the past year.
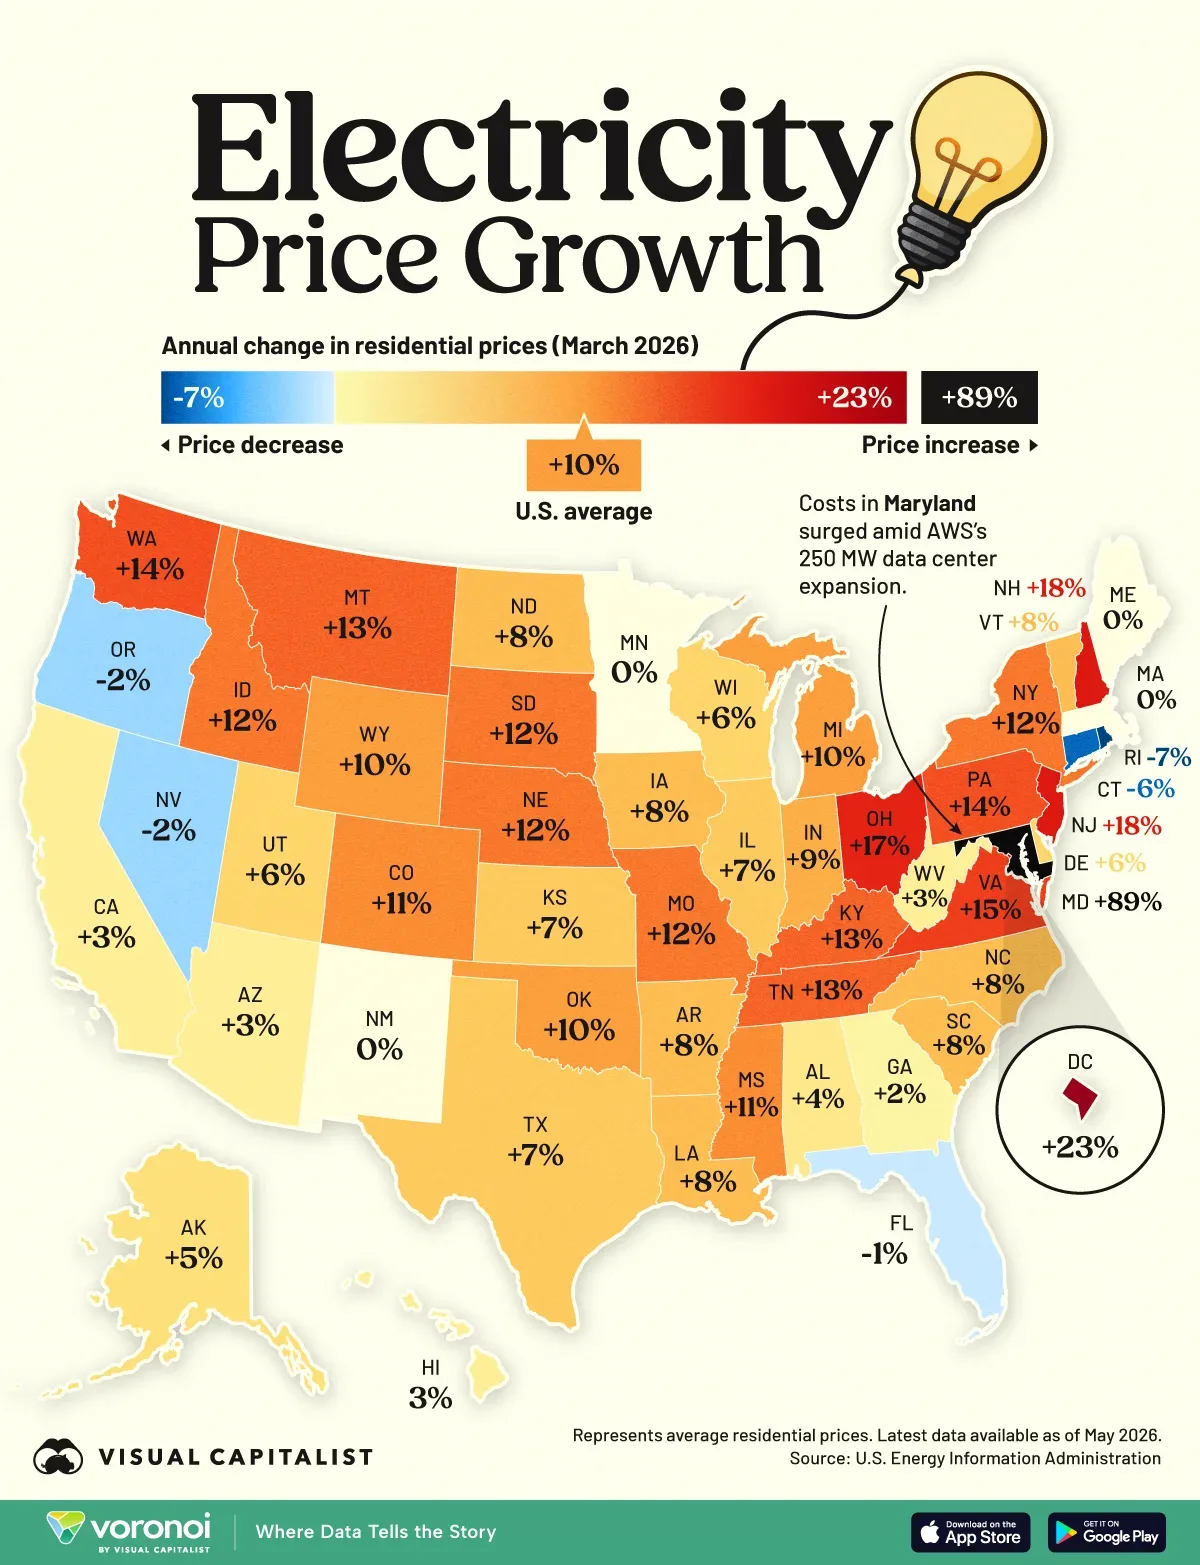
- The national average electricity price rose 10%, but several Mid-Atlantic and Northeastern states posted increases well above that level.
- While prices surged across much of the East, electricity costs fell in Rhode Island, Connecticut, Oregon, and Nevada.
Electricity prices are becoming one of the fastest-rising household expenses in parts of America.
Using data from the U.S. Energy Information Administration (EIA), this map shows how residential electricity prices changed across all 50 states over the past year.
The differences are striking. Maryland saw electricity prices surge 89% year over year, nearly nine times the national average increase of 10%, while several states in the West saw little change or outright declines.
Much of the pressure is being driven by rising grid investment costs and growing electricity demand, including from AI-related data center expansion in some regions.
Electricity Price Growth by State
The following table shows the annual change in average residential electricity prices by state in March 2026.
| Rank | State | Annual Change in Residential Electricity Prices Mar 2026 |
|---|---|---|
| 1 | Maryland | 89.3% |
| 2 | District of Columbia | 22.5% |
| 3 | New Jersey | 18.2% |
| 4 | New Hampshire | 18.0% |
| 5 | Ohio | 16.6% |
| 6 | Virginia | 14.5% |
| 7 | Washington | 14.1% |
| 8 | Pennsylvania | 13.6% |
| 9 | Montana | 13.0% |
| 10 | Tennessee | 12.8% |
| 11 | Kentucky | 12.7% |
| 12 | Idaho | 12.4% |
| 13 | New York | 12.2% |
| 14 | South Dakota | 12.1% |
| 15 | Missouri | 11.9% |
| 16 | Nebraska | 11.9% |
| 17 | Mississippi | 11.3% |
| 18 | Colorado | 11.3% |
| 19 | Oklahoma | 9.6% |
| 20 | Michigan | 9.6% |
| 21 | Wyoming | 9.5% |
| 22 | Indiana | 8.8% |
| 23 | Louisiana | 8.4% |
| 24 | Arkansas | 8.3% |
| 25 | North Carolina | 8.1% |
| 26 | Vermont | 7.7% |
| 27 | South Carolina | 7.7% |
| 28 | North Dakota | 7.6% |
| 29 | Iowa | 7.5% |
| 30 | Illinois | 7.5% |
| 31 | Texas | 7.3% |
| 32 | Kansas | 7.0% |
| 33 | Utah | 6.3% |
| 34 | Wisconsin | 5.9% |
| 35 | Delaware | 5.6% |
| 36 | Alaska | 5.4% |
| 37 | Alabama | 3.6% |
| 38 | West Virginia | 3.0% |
| 39 | Arizona | 3.0% |
| 40 | Hawaii | 2.7% |
| 41 | California | 2.7% |
| 42 | Georgia | 2.2% |
| 43 | New Mexico | 0.2% |
| 44 | Maine | 0.2% |
| 45 | Massachusetts | 0.1% |
| 46 | Minnesota | -0.1% |
| 47 | Florida | -1.5% |
| 48 | Oregon | -1.8% |
| 49 | Nevada | -1.8% |
| 50 | Connecticut | -6.2% |
| 51 | Rhode Island | -7.4% |
| — |  U.S. Average U.S. Average |
10.2% |
Where Electricity Bills Are Surging the Most
Electricity prices climbed sharply across much of America over the past year, but the increases varied significantly by region.
Several Mid-Atlantic and Northeastern states recorded some of the nation’s largest increases. Washington D.C. saw prices rise 23%, while New Jersey and New Hampshire both posted gains of 18%. Ohio followed at 17%. Maryland was the clear outlier, recording by far the largest price jump nationwide.
For households in the hardest-hit states, electricity bills are becoming a larger budget concern. Unlike many consumer purchases, electricity is a recurring necessity, meaning even moderate price increases can quickly add up over a year.
Why Utility Costs Are Climbing Nationwide
Electricity prices are rising as America’s power grid faces growing strain from aging infrastructure and surging demand.
Utilities are investing billions into grid upgrades, transmission networks, and wildfire prevention projects, while electricity demand is accelerating due to AI data centers, population growth, and the shift toward electric vehicles and electric heating systems.
AI-related data center growth is becoming a major source of new electricity demand. In Maryland, for example, Amazon Web Services recently expanded its data center operations as utilities across the region race to keep up with rising power needs.
In PJM Interconnection—the largest U.S. power market serving 13 Eastern states and Washington D.C.—wholesale electricity prices surged 76% year over year in early 2026 as data center demand accelerated. Analysts warned many of those costs could ultimately be passed on to households through higher utility bills.
America’s Growing Electricity Divide
The map highlights a widening regional split in electricity costs. Many Mid-Atlantic and Northeastern states experienced double-digit price increases, while parts of the West saw relatively stable prices or outright declines.
Rhode Island recorded the largest drop in electricity prices at -7%, followed by Connecticut at -6%. Oregon and Nevada both saw prices fall 2% over the past year.
The differences reflect how electricity markets vary widely across the U.S., with regional fuel mixes, grid investment needs, regulatory structures, and demand growth all shaping local utility costs.
As AI data centers, electrification, and grid expansion reshape power demand, utility costs are starting to diverge sharply between regions. For consumers, electricity is increasingly shifting from a stable household expense into a more volatile and regionally uneven cost burden.
Learn More on the Voronoi App 
To learn more about this topic, check out this graphic showing the number of data centers by country.
- Source: https://www.visualcapitalist.com/mapped-where-electricity-prices-jumped-the-most-in-america/