Ranked: Which States Use AI the Most?
See visuals like this from many other data creators on our Voronoi app. Download it for free on iOS or Android and discover incredible data-driven charts from a variety of trusted sources.
Key Takeaways
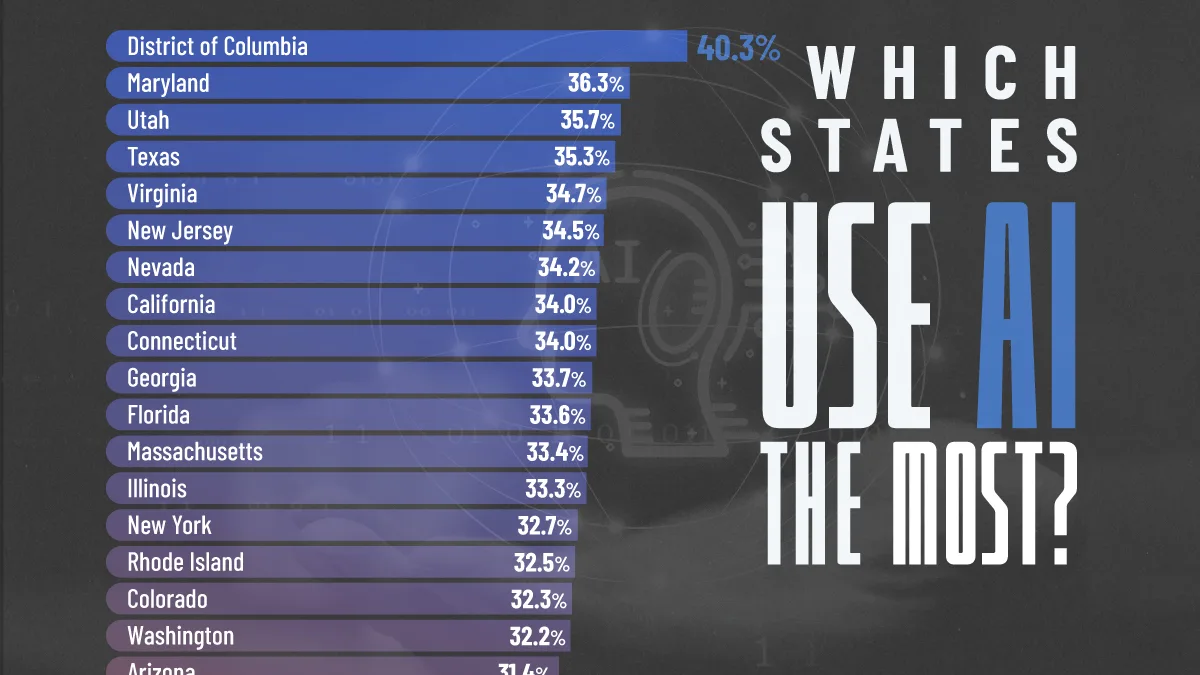
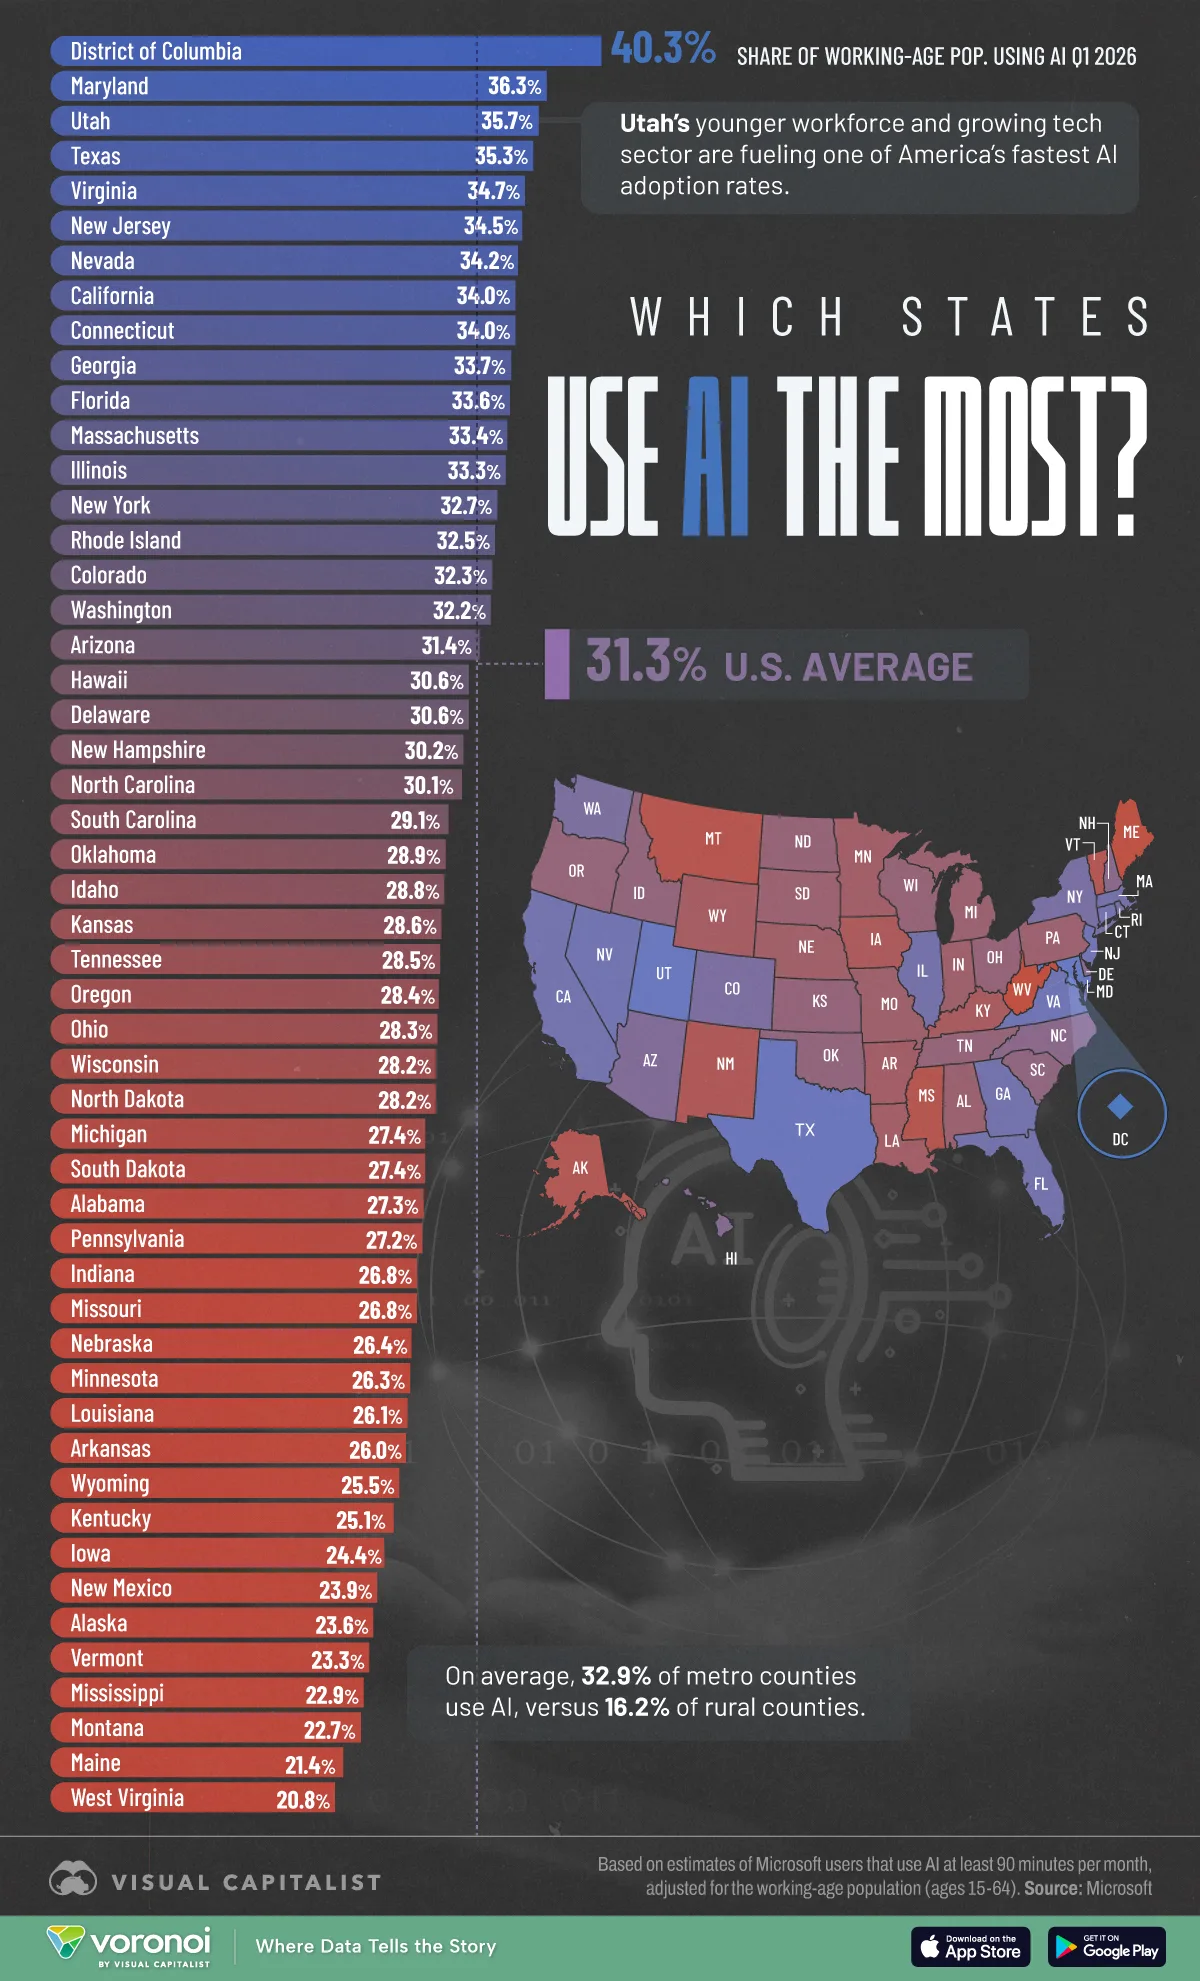
- Washington, D.C. leads the nation in AI adoption, with 40.3% of working-age residents using AI.
- Maryland, Utah, Texas, and Virginia round out the top five states for AI usage.
- Americans living in metro counties use AI at roughly twice the rate of those in rural counties.
Despite leading the world in AI investment and development, AI adoption remains uneven across the United States.
This map ranks every state by the share of working-age residents using AI in Q1 2026, based on Microsoft estimates of people who engage with AI for at least 90 minutes per month.
Washington, D.C. leads the nation, while several Sun Belt and Mid-Atlantic states rank among America’s fastest adopters.
AI Adoption by State in 2026
The following table shows the share of adults ages 15 to 64 using AI in every state.
| Rank | State or District | Share of Working-Age Population Using AI Q1 2026 |
|---|---|---|
| 1 | District of Columbia | 40.3% |
| 2 | Maryland | 36.3% |
| 3 | Utah | 35.7% |
| 4 | Texas | 35.3% |
| 5 | Virginia | 34.7% |
| 6 | New Jersey | 34.5% |
| 7 | Nevada | 34.2% |
| 8 | California | 34.0% |
| 9 | Connecticut | 34.0% |
| 10 | Georgia | 33.7% |
| 11 | Florida | 33.6% |
| 12 | Massachusetts | 33.4% |
| 13 | Illinois | 33.3% |
| 14 | New York | 32.7% |
| 15 | Rhode Island | 32.5% |
| 16 | Colorado | 32.3% |
| 17 | Washington | 32.2% |
| 18 | Arizona | 31.4% |
| 19 | Hawaii | 30.6% |
| 20 | Delaware | 30.6% |
| 21 | New Hampshire | 30.2% |
| 22 | North Carolina | 30.1% |
| 23 | South Carolina | 29.1% |
| 24 | Oklahoma | 28.9% |
| 25 | Idaho | 28.8% |
| 26 | Kansas | 28.6% |
| 27 | Tennessee | 28.5% |
| 28 | Oregon | 28.4% |
| 29 | Ohio | 28.3% |
| 30 | Wisconsin | 28.2% |
| 31 | North Dakota | 28.2% |
| 32 | Michigan | 27.4% |
| 33 | South Dakota | 27.4% |
| 34 | Alabama | 27.3% |
| 35 | Pennsylvania | 27.2% |
| 36 | Indiana | 26.8% |
| 37 | Missouri | 26.8% |
| 38 | Nebraska | 26.4% |
| 39 | Minnesota | 26.3% |
| 40 | Louisiana | 26.1% |
| 41 | Arkansas | 26.0% |
| 42 | Wyoming | 25.5% |
| 43 | Kentucky | 25.1% |
| 44 | Iowa | 24.4% |
| 45 | New Mexico | 23.9% |
| 46 | Alaska | 23.6% |
| 47 | Vermont | 23.3% |
| 48 | Mississippi | 22.9% |
| 49 | Montana | 22.7% |
| 50 | Maine | 21.4% |
| 51 | West Virginia | 20.8% |
| — |  U.S. Average U.S. Average |
31.3% |
State averages only tell part of the story.
At the county level, adoption rates can be dramatically higher. Williamsburg, Virginia, home to William & Mary, recorded the highest AI adoption rate in America at 73.2%, highlighting the outsized role that university and research communities play in spreading new technologies.
The Geography of AI Adoption
One of the clearest patterns in the data is the gap between metro and rural America.
According to Microsoft’s estimates, 32.9% of metro-county residents use AI, compared with 16.2% in rural counties. As a result, adoption is roughly twice as high in urban areas.
The gap largely reflects where knowledge-work jobs are concentrated. Metro areas have higher shares of workers in technology, finance, consulting, education, government, and professional services, where AI tools are increasingly used for writing, coding, research, analysis, and administrative work.
Rural areas, by contrast, generally have fewer digital-intensive jobs. That does not mean AI has less potential there, but adoption may progress more slowly if workers have fewer opportunities to encounter the technology in their day-to-day work.
In practical terms, Americans in large metro areas are more likely to be exposed to AI at work, trained on AI tools, and pushed to adopt them by employers.
Why D.C., Maryland, and Utah Rank So High
Washington, D.C. ranks first, with 40.3% of working-age residents using AI.
The result reflects the region’s concentration of government, legal, consulting, policy, and research jobs. These are fields where AI can be used to summarize documents, draft communications, analyze information, and speed up knowledge work.
Maryland ranks second at 36.3%, aided by its proximity to Washington, D.C. and its large base of contractors, cybersecurity firms, and research institutions.
Utah ranks third at 35.7%, offering one of the clearest examples of strong AI adoption outside the traditional coastal tech hubs. The state’s younger workforce and growing tech sector have helped make it one of America’s fastest-adopting AI markets.
Texas, Virginia, New Jersey, Nevada, and California also rank near the top, showing that AI use is spreading across a mix of tech hubs, business centers, and fast-growing states.
Why This Matters
As AI becomes a standard workplace tool, adoption rates may increasingly influence which regions attract investment, talent, and high-paying jobs.
Areas where workers are already using AI at scale could gain productivity advantages and become early beneficiaries of AI-driven growth. Meanwhile, regions with lower adoption rates may face pressure to catch up as businesses integrate AI into everyday operations.
In that sense, today’s AI adoption map may offer an early glimpse into tomorrow’s economic geography.
Learn More on the Voronoi App 
To learn more about this topic, check out this graphic on the jobs most exposed to AI.