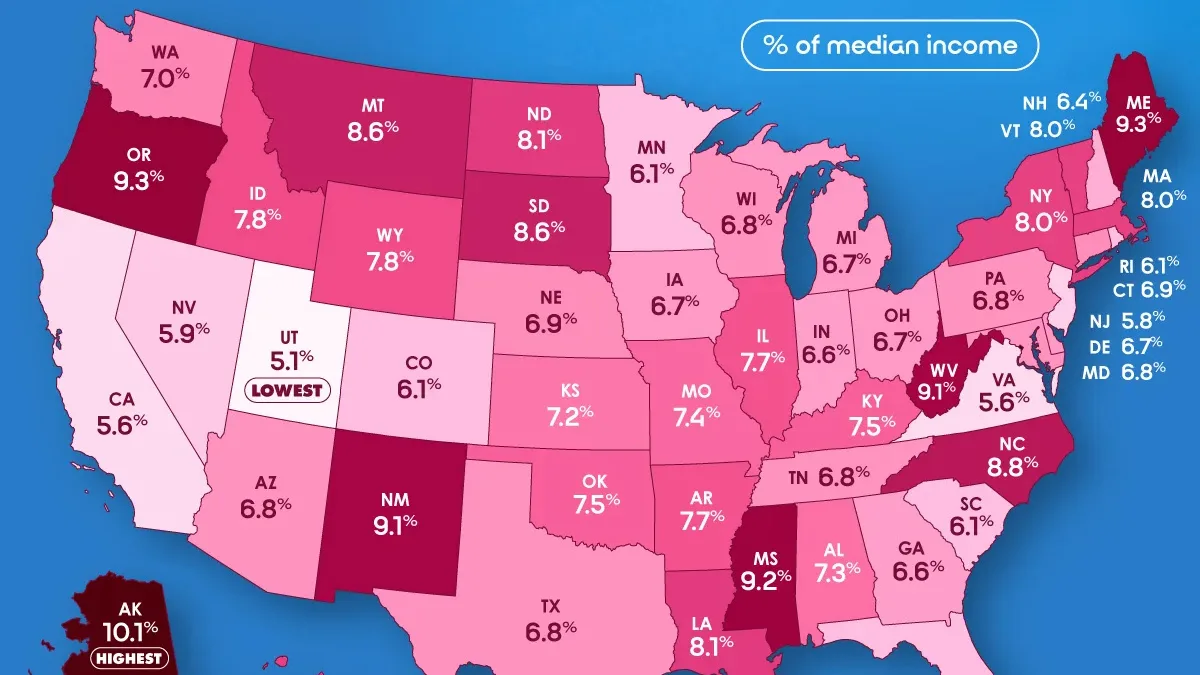
Mapped: Health Care Costs as a Share of Income by State
See visuals like this from many other data creators on our Voronoi app. Download it for free on iOS or Android and discover data-driven charts from a variety of trusted sources.
Key Takeaways
- Alaska ranks as the most expensive state for health care relative to income, with medical costs accounting for more than 10% of median monthly household income.
- California ranks among the most affordable states for health care relative to income, despite its reputation for high medical costs.
- The gap between states highlights how both medical prices and household incomes shape the cost of care.
The states with the highest health care prices aren’t always the ones where health care takes the biggest financial toll.
This map shows how much selected health care expenses account for as a share of median monthly household income across America. The measure includes doctor, dentist, and optometrist visits, along with ibuprofen and insulin. Data comes from WalletHub.
The results reveal large differences in affordability, with health care consuming nearly twice as much income in some states as in others.
Alaska Tops the Ranking
In Alaska, selected health care expenses consume more than 10% of median household income, the highest share in the country. That’s nearly double the burden faced by households in Utah, the most affordable state in the ranking.
| Rank | State | Health Care as % of Household Income |
|---|---|---|
| 1 | Alaska | 10.08% |
| 2 | Oregon | 9.32% |
| 3 | Maine | 9.30% |
| 4 | Mississippi | 9.18% |
| 5 | West Virginia | 9.14% |
| 6 | New Mexico | 9.07% |
| 7 | North Carolina | 8.78% |
| 8 | Montana | 8.62% |
| 9 | South Dakota | 8.60% |
| 10 | Louisiana | 8.13% |
| 11 | North Dakota | 8.08% |
| 12 | Massachusetts | 8.00% |
| 13 | Hawaii | 8.00% |
| 14 | Vermont | 7.98% |
| 15 | New York | 7.98% |
| 16 | Wyoming | 7.84% |
| 17 | Idaho | 7.82% |
| 18 | Illinois | 7.71% |
| 19 | Arkansas | 7.67% |
| 20 | Oklahoma | 7.51% |
| 21 | Kentucky | 7.46% |
| 22 | Missouri | 7.43% |
| 23 | Alabama | 7.32% |
| 24 | Kansas | 7.19% |
| 25 | Washington | 7.01% |
| 26 | Connecticut | 6.89% |
| 27 | Nebraska | 6.87% |
| 28 | Arizona | 6.81% |
| 29 | Pennsylvania | 6.80% |
| 30 | Texas | 6.77% |
| 31 | Tennessee | 6.77% |
| 32 | Maryland | 6.76% |
| 33 | Wisconsin | 6.76% |
| 34 | Iowa | 6.74% |
| 35 | Ohio | 6.68% |
| 36 | Delaware | 6.66% |
| 37 | Michigan | 6.65% |
| 38 | Indiana | 6.64% |
| 39 | Georgia | 6.62% |
| 40 | New Hampshire | 6.42% |
| 41 | South Carolina | 6.13% |
| 42 | Minnesota | 6.09% |
| 43 | Rhode Island | 6.09% |
| 44 | Florida | 6.05% |
| 45 | Colorado | 6.05% |
| 46 | Nevada | 5.87% |
| 47 | New Jersey | 5.81% |
| 48 | California | 5.64% |
| 49 | Virginia | 5.62% |
| 50 | Utah | 5.11% |
This is notable because Alaska is not a low-income state. However, the state has the highest doctor visit costs in the dataset and the second-highest dentist visit costs.
Its geography likely adds pressure to prices, as remote communities can face higher transportation, staffing, and supply costs.
Costs Hit Hard in Lower-Income States
Several states in the South and Appalachia also rank near the top.
Mississippi ranks fourth at 9.18%, while West Virginia and New Mexico both come in at around 9.1%. In these states, health care costs can take up a larger share of monthly budgets even when prices are not the highest nationally.
This highlights how affordability depends on both prices and income.
High Incomes Help Lower the Burden
At the other end of the ranking, Utah has the lowest cost burden at 5.11%.
California and Virginia follow closely, each at around 5.6%. While many health care costs in California are high in absolute terms, higher median household incomes help reduce their burden as a share of monthly budgets.
Learn More on the Voronoi App 
If you enjoyed today’s post, check out Ranked: The 30 Highest-Paying Jobs in America on Voronoi.