Ranked: Jobs With the Highest and Lowest Divorce Rates
See visuals like this from many other data creators on our Voronoi app. Download it for free on iOS or Android and discover incredible data-driven charts from a variety of trusted sources.
Key Takeaways
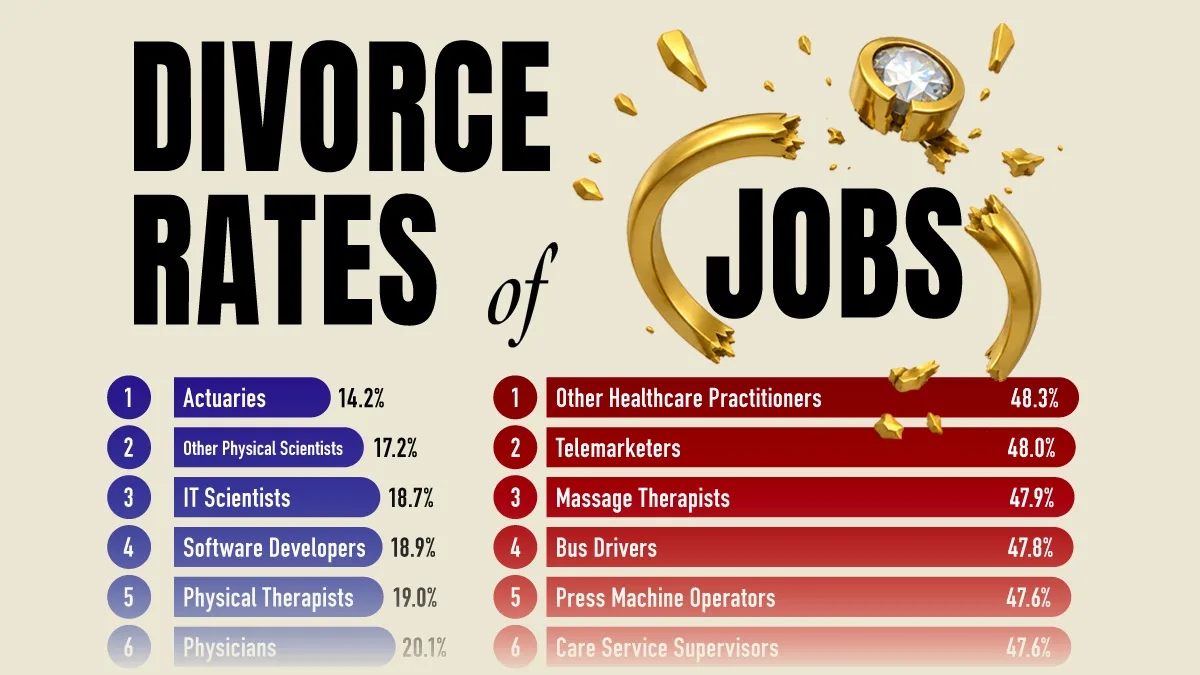
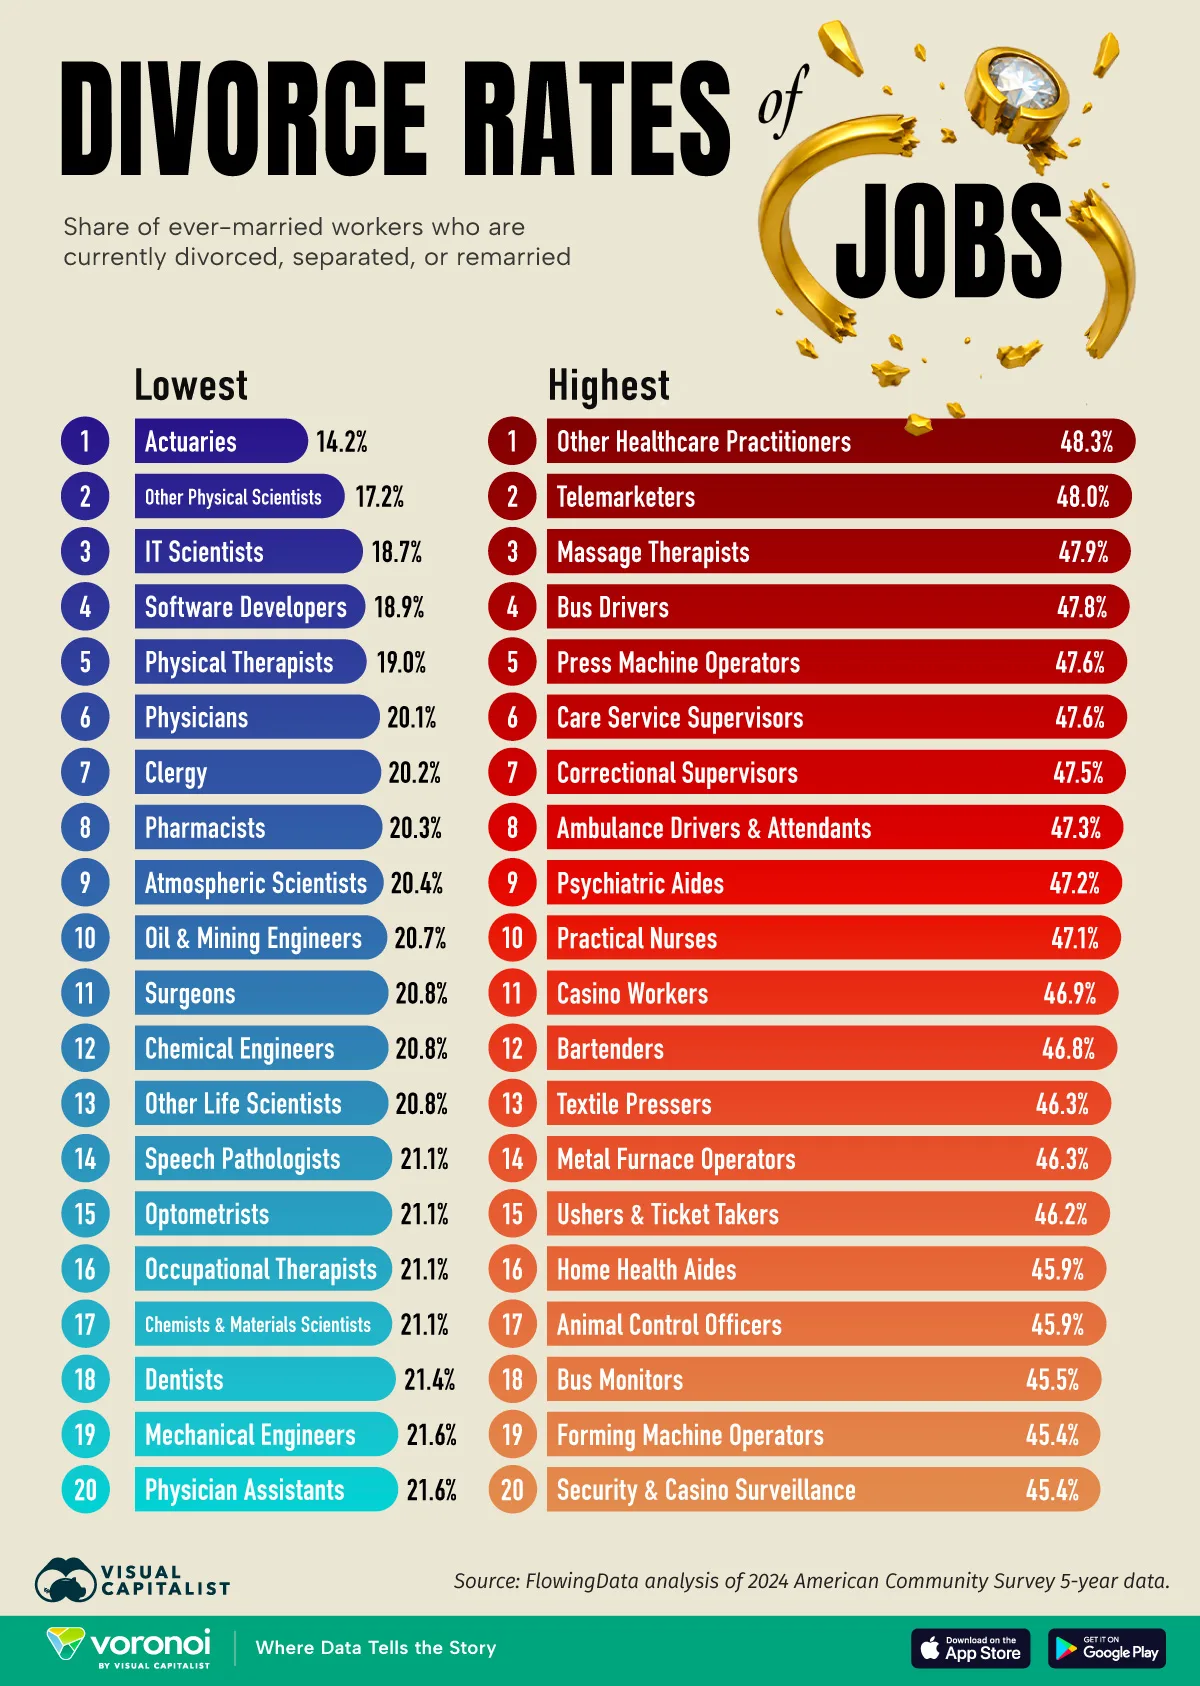
- Divorce rates vary dramatically by occupation, ranging from just 14.2% among actuaries to nearly 50% in several service and healthcare support roles.
- The average divorce rate among the 20 highest-divorce occupations is 46.8%, versus 20.1% among the 20 lowest-divorce occupations.
- Healthcare workers appear on both ends of the ranking, suggesting job conditions may matter as much as industry.
Actuaries have America’s lowest divorce rate at 14.2%. At the other extreme, several occupations report divorce rates near 48%, highlighting a striking divide across the U.S. workforce.
Using American Community Survey data compiled by FlowingData, the graphic above ranks the occupations with the highest and lowest divorce rates among more than 500 jobs.
One of the ranking’s most surprising findings is that healthcare occupations appear on both sides. Physicians, dentists, and physical therapists rank among America’s lowest-divorce occupations, while home health aides, psychiatric aides, and practical nurses rank among the highest.
The contrast suggests that schedules, working conditions, and job structure may play a larger role than industry alone.
The Jobs With the Lowest Divorce Rates
America’s lowest-divorce occupations are remarkably similar. Most require years of advanced education, professional licensing, or specialized technical expertise.
| Rank | Occupation | Divorce Rate |
|---|---|---|
| 1 | Actuaries | 14.2% |
| 2 | Other Physical Scientists | 17.2% |
| 3 | IT Scientists | 18.7% |
| 4 | Software Developers | 18.9% |
| 5 | Physical Therapists | 19.0% |
| 6 | Physicians | 20.1% |
| 7 | Clergy | 20.2% |
| 8 | Pharmacists | 20.3% |
| 9 | Atmospheric Scientists | 20.4% |
| 10 | Oil & Mining Engineers | 20.7% |
| 11 | Surgeons | 20.8% |
| 12 | Chemical Engineers | 20.8% |
| 13 | Other Life Scientists | 20.8% |
| 14 | Speech Pathologists | 21.1% |
| 15 | Optometrists | 21.1% |
| 16 | Occupational Therapists | 21.1% |
| 17 | Chemists & Materials Scientists | 21.1% |
| 18 | Dentists | 21.4% |
| 19 | Mechanical Engineers | 21.6% |
| 20 | Physician Assistants | 21.6% |
Education appears to be one factor. Census-based research shows divorce rates generally decline as education levels rise.
Individuals with only a high school diploma experienced a divorce rate of 38.8%, compared with 30.1% for those with an associate degree and 25.9% for those holding at least a bachelor’s degree.
Notably, America’s lowest-divorce occupations include not only high earners such as physicians and dentists, but also clergy, one of the few modest-paying professions in the group.
The Jobs With the Highest Divorce Rates
Telemarketers, bus drivers, bartenders, home health aides, psychiatric aides, casino workers, and security personnel all rank among America’s highest-divorce occupations, with rates exceeding 45%.
The occupations at the opposite end of the ranking share a different set of characteristics. Many involve irregular schedules, shift work, public-facing responsibilities, or emotionally demanding working conditions.
| Rank | Occupation | Divorce Rate |
|---|---|---|
| 1 | Other Healthcare Practitioners | 48.3% |
| 2 | Telemarketers | 48.0% |
| 3 | Massage Therapists | 47.9% |
| 4 | Bus Drivers | 47.8% |
| 5 | Press Machine Operators | 47.6% |
| 6 | Care Service Supervisors | 47.6% |
| 7 | Correctional Supervisors | 47.5% |
| 8 | Ambulance Drivers & Attendants | 47.3% |
| 9 | Psychiatric Aides | 47.2% |
| 10 | Practical Nurses | 47.1% |
| 11 | Casino Workers | 46.9% |
| 12 | Bartenders | 46.8% |
| 13 | Textile Pressers | 46.3% |
| 14 | Metal Furnace Operators | 46.3% |
| 15 | Ushers & Ticket Takers | 46.2% |
| 16 | Home Health Aides | 45.9% |
| 17 | Animal Control Officers | 45.9% |
| 18 | Bus Monitors | 45.5% |
| 19 | Forming Machine Operators | 45.4% |
| 20 | Security & Casino Surveillance | 45.4% |
Work schedules may be part of the explanation. A landmark study of more than 3,400 married couples found that irregular schedules, such as night shifts, were associated with significantly higher odds of separation or divorce than regular daytime work.
Other research has linked night-shift work to greater marital instability and work-family conflict, particularly for new parents.
The Surprising Healthcare Divide
One of the ranking’s most surprising findings is that healthcare occupations appear on both sides.
Physicians, surgeons, dentists, physical therapists, optometrists, and physician assistants all rank among the lowest-divorce occupations in America.
Yet healthcare support roles tell a very different story. Home health aides, psychiatric aides, practical nurses, ambulance attendants, and other healthcare support workers rank among the highest-divorce occupations.
The divide suggests that job conditions may matter as much as industry. Workers in healthcare can face vastly different schedules, levels of autonomy, educational requirements, and workplace pressures, even while serving similar patient populations. In other words, two people can work in healthcare and face entirely different relationship pressures depending on their role.
What the Rankings Reveal
The rankings suggest that occupation and family life may be more connected than many people realize. While no profession determines whether a marriage succeeds, factors such as work schedules, stress levels, educational attainment, and job autonomy appear to be linked with markedly different divorce outcomes.
The healthcare divide is perhaps the clearest example. People working in the same industry can face entirely different relationship pressures depending on the role they hold.
Learn More on the Voronoi App 
To learn more about this topic, check out this graphic on America’s 30 highest-paying jobs.