Ranked: The Countries That Brew the Most Beer
See visuals like this from many other data creators on our Voronoi app. Download it for free on iOS or Android and discover data-driven charts from a variety of trusted sources.
Key Takeaways
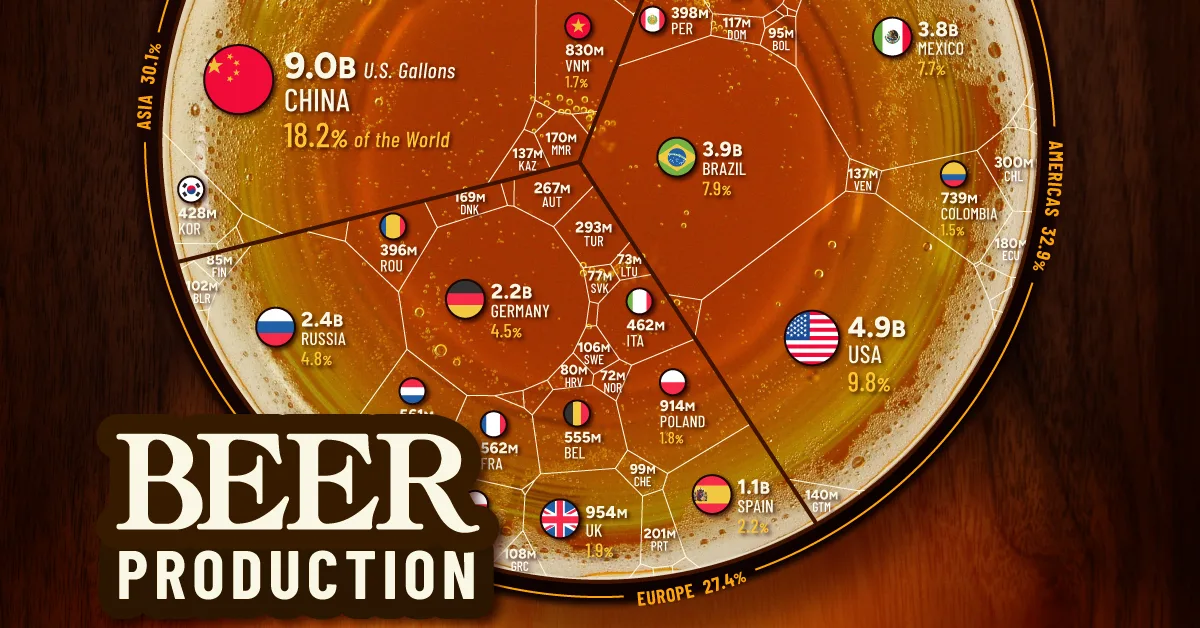
- China brewed 9.0 billion gallons of beer in 2024, producing nearly one in every five beers worldwide.
- The top five beer-producing countries accounted for almost half of global output.
- Africa was the fastest-growing beer region in 2024, led by strong gains in Angola and South Africa.
Beer is consumed almost everywhere, but brewing at scale is a different story.
Behind many of the world’s biggest beer brands are countries producing billions of gallons each year for domestic drinkers and export markets.
This visualization ranks the world’s largest beer producers in 2024, measured in U.S. gallons, using data from the BarthHaas Report 2024/25.
China Still Leads by a Wide Margin
China brewed 9.0 billion gallons of beer in 2024, making it the world’s largest producer by far.
That works out to 18.2% of global beer output, or nearly one in every five beers brewed worldwide. China also produced more beer than the United States and Brazil combined.
| Rank | Country | Beer Output (Billion Gallons) | Share of World (2024) |
|---|---|---|---|
| 1 |  China China |
9.01 | 18.2% |
| 2 |  United States United States |
4.87 | 9.8% |
| 3 |  Brazil Brazil |
3.89 | 7.9% |
| 4 |  Mexico Mexico |
3.83 | 7.7% |
| 5 |  Russia Russia |
2.40 | 4.8% |
| 6 |  Germany Germany |
2.22 | 4.5% |
| 7 |  Japan Japan |
1.18 | 2.4% |
| 8 |  Spain Spain |
1.09 | 2.2% |
| 9 |  South Africa South Africa |
0.98 | 2.0% |
| 10 |  United Kingdom United Kingdom |
0.95 | 1.9% |
| 11 |  Poland Poland |
0.91 | 1.8% |
| 12 |  India India |
0.87 | 1.7% |
| 13 |  Vietnam Vietnam |
0.83 | 1.7% |
| 14 |  Colombia Colombia |
0.74 | 1.5% |
| 15 |  Thailand Thailand |
0.60 | 1.2% |
| 16 |  France France |
0.56 | 1.1% |
| 17 |  Netherlands Netherlands |
0.56 | 1.1% |
| 18 |  Belgium Belgium |
0.55 | 1.1% |
| 19 |  Canada Canada |
0.54 | 1.1% |
| 20 |  Argentina Argentina |
0.54 | 1.1% |
| 21 |  Czech Republic Czech Republic |
0.53 | 1.1% |
| 22 |  Nigeria Nigeria |
0.51 | 1.0% |
| 23 |  Italy Italy |
0.46 | 0.9% |
| 24 |  Philippines Philippines |
0.46 | 0.9% |
| 25 |  Angola Angola |
0.43 | 0.9% |
| 26 |  South Korea South Korea |
0.428 | 0.9% |
| 27 |  Cambodia Cambodia |
0.423 | 0.9% |
| 28 |  Peru Peru |
0.398 | 0.8% |
| 29 |  Romania Romania |
0.396 | 0.8% |
| 30 |  Ukraine Ukraine |
0.37 | 0.7% |
| 31 |  Australia Australia |
0.368 | 0.7% |
| 32 |  Ethiopia Ethiopia |
0.362 | 0.7% |
| 33 |  Chile Chile |
0.300 | 0.6% |
| 34 |  Turkey Turkey |
0.293 | 0.6% |
| 35 |  Austria Austria |
0.267 | 0.5% |
| 36 |  Cameroon Cameroon |
0.246 | 0.5% |
| 37 |  Ireland Ireland |
0.219 | 0.4% |
| 38 |  Portugal Portugal |
0.201 | 0.4% |
| 39 |  Ecuador Ecuador |
0.180 | 0.4% |
| 40 |  Myanmar Myanmar |
0.170 | 0.3% |
| 41 |  Denmark Denmark |
0.169 | 0.3% |
| 42 |  Laos Laos |
0.159 | 0.3% |
| 43 |  Hungary Hungary |
0.147 | 0.3% |
| 44 |  DR Congo DR Congo |
0.142 | 0.3% |
| 45 |  Guatemala Guatemala |
0.140 | 0.3% |
| 46 |  Venezuela Venezuela |
0.137 | 0.3% |
| 47 |  Kazakhstan Kazakhstan |
0.137 | 0.3% |
| 48 |  Taiwan Taiwan |
0.133 | 0.3% |
| 49 |  Tanzania Tanzania |
0.128 | 0.3% |
| 50 |  Ivory Coast Ivory Coast |
0.127 | 0.3% |
| 51 |  Bulgaria Bulgaria |
0.124 | 0.3% |
| 52 |  Dominican Republic Dominican Republic |
0.117 | 0.2% |
| 53 |  Mozambique Mozambique |
0.112 | 0.2% |
| 54 |  Kenya Kenya |
0.111 | 0.2% |
| 55 |  Greece Greece |
0.108 | 0.2% |
| 56 |  Sweden Sweden |
0.106 | 0.2% |
| 57 |  Uganda Uganda |
0.105 | 0.2% |
| 58 |  Belarus Belarus |
0.102 | 0.2% |
| 59 |  Switzerland Switzerland |
0.0992 | 0.2% |
| 60 |  Ghana Ghana |
0.0979 | 0.2% |
| 61 |  Congo (Brazzaville) Congo (Brazzaville) |
0.0951 | 0.2% |
| 62 |  Bolivia Bolivia |
0.0948 | 0.2% |
| 63 |  Panama Panama |
0.0893 | 0.2% |
| 64 |  Indonesia Indonesia |
0.0880 | 0.2% |
| 65 |  Serbia Serbia |
0.0855 | 0.2% |
| 66 |  Finland Finland |
0.0853 | 0.2% |
| 67 |  Burkina Faso Burkina Faso |
0.0819 | 0.2% |
| 68 |  Croatia Croatia |
0.0796 | 0.2% |
| 69 |  New Zealand New Zealand |
0.0782 | 0.2% |
| 70 |  Slovakia Slovakia |
0.0766 | 0.2% |
| 71 |  Paraguay Paraguay |
0.0759 | 0.2% |
| 72 |  Lithuania Lithuania |
0.0734 | 0.1% |
| 73 |  Norway Norway |
0.0721 | 0.1% |
| 74 |  Uzbekistan Uzbekistan |
0.0713 | 0.1% |
| 75 |  Zimbabwe Zimbabwe |
0.0650 | 0.1% |
| 76 |  Cuba Cuba |
0.0648 | 0.1% |
| 77 |  Zambia Zambia |
0.0618 | 0.1% |
| 78 |  Sri Lanka Sri Lanka |
0.0555 | 0.1% |
| 79 |  Gabon Gabon |
0.0528 | 0.1% |
| 80 |  Nepal Nepal |
0.0528 | 0.1% |
| 81 |  Israel Israel |
0.0526 | 0.1% |
| 82 |  Namibia Namibia |
0.0489 | 0.1% |
| 83 |  Slovenia Slovenia |
0.0476 | 0.1% |
| 84 |  Tunisia Tunisia |
0.0454 | 0.1% |
| 85 |  Uruguay Uruguay |
0.0447 | 0.1% |
| 86 |  Lesotho Lesotho |
0.0439 | 0.1% |
| 87 |  Rwanda Rwanda |
0.0426 | 0.1% |
| 88 |  Costa Rica Costa Rica |
0.0416 | 0.1% |
| 89 |  Moldova Moldova |
0.0396 | 0.1% |
| 90 |  Malaysia Malaysia |
0.0396 | 0.1% |
| 91 |  Algeria Algeria |
0.0396 | 0.1% |
| 92 |  Honduras Honduras |
0.0394 | 0.1% |
| 93 |  Madagascar Madagascar |
0.0375 | 0.1% |
| 94 |  Georgia Georgia |
0.0359 | 0.1% |
| 95 |  El Salvador El Salvador |
0.0350 | 0.1% |
| 96 |  Benin Benin |
0.0338 | 0.1% |
| 97 |  Togo Togo |
0.0328 | 0.1% |
| 98 |  Nicaragua Nicaragua |
0.0320 | 0.1% |
| 99 |  Singapore Singapore |
0.0317 | 0.1% |
| 100 |  Malawi Malawi |
0.0306 | 0.1% |
| 101 |  Mongolia Mongolia |
0.0291 | 0.1% |
| 102 |  Puerto Rico Puerto Rico |
0.0291 | 0.1% |
| 103 |  Chad Chad |
0.0251 | 0.1% |
| 104 |  Egypt Egypt |
0.0249 | 0.1% |
| 105 |  Estonia Estonia |
0.0248 | 0.1% |
| 106 |  Iran Iran |
0.0238 | 0.0% |
| 107 |  Bosnia-Herzegovina Bosnia-Herzegovina |
0.0218 | 0.0% |
| 108 |  Morocco Morocco |
0.0216 | 0.0% |
| 109 |  Botswana Botswana |
0.0208 | 0.0% |
| 110 |  Albania Albania |
0.0199 | 0.0% |
| 111 |  Latvia Latvia |
0.0195 | 0.0% |
| 112 |  Papua New Guinea Papua New Guinea |
0.0181 | 0.0% |
| 113 |  Trinidad and Tobago Trinidad and Tobago |
0.0157 | 0.0% |
| 114 |  Azerbaijan Azerbaijan |
0.0137 | 0.0% |
| 115 |  Kyrgyzstan Kyrgyzstan |
0.0135 | 0.0% |
| 116 |  Mauritius Mauritius |
0.0135 | 0.0% |
| 117 |  Guyana Guyana |
0.0131 | 0.0% |
| 118 |  North Macedonia North Macedonia |
0.0129 | 0.0% |
| 119 |  Bhutan Bhutan |
0.0127 | 0.0% |
| 120 |  Hong Kong Hong Kong |
0.0127 | 0.0% |
| 121 |  Cyprus Cyprus |
0.0113 | 0.0% |
| 122 |  Jamaica Jamaica |
0.0109 | 0.0% |
| 123 |  Guinea Guinea |
0.0101 | 0.0% |
| 124 |  Equatorial Guinea Equatorial Guinea |
0.00946 | 0.0% |
| 125 |  Armenia Armenia |
0.00930 | 0.0% |
| 126 |  Turkmenistan Turkmenistan |
0.00925 | 0.0% |
| 127 |  Tajikistan Tajikistan |
0.00859 | 0.0% |
| 128 |  Burundi Burundi |
0.00845 | 0.0% |
| 129 |  Lebanon Lebanon |
0.00845 | 0.0% |
| 130 |  Central African Republic Central African Republic |
0.00753 | 0.0% |
| 131 |  Eritrea Eritrea |
0.00740 | 0.0% |
| 132 |  Montenegro Montenegro |
0.00740 | 0.0% |
| 133 |  Jordan Jordan |
0.00663 | 0.0% |
| 134 |  Réunion Réunion |
0.00594 | 0.0% |
| 135 |  Eswatini Eswatini |
0.00594 | 0.0% |
| 136 |  Luxembourg Luxembourg |
0.00586 | 0.0% |
| 137 |  Malta Malta |
0.00518 | 0.0% |
| 138 |  Haiti Haiti |
0.00515 | 0.0% |
| 139 |  Iceland Iceland |
0.00507 | 0.0% |
| 140 |  Mali Mali |
0.00502 | 0.0% |
| 141 |  Sierra Leone Sierra Leone |
0.00499 | 0.0% |
| 142 |  Tahiti (French Polynesia) Tahiti (French Polynesia) |
0.00476 | 0.0% |
| 143 |  Senegal Senegal |
0.00462 | 0.0% |
| 144 |  St. Lucia St. Lucia |
0.00457 | 0.0% |
| 145 |  Liberia Liberia |
0.00396 | 0.0% |
| 146 |  New Caledonia New Caledonia |
0.00396 | 0.0% |
| 147 |  Bahamas Bahamas |
0.00386 | 0.0% |
| 148 |  Fiji Fiji |
0.00370 | 0.0% |
| 149 |   Dutch Antilles Dutch Antilles |
0.00365 | 0.0% |
| 150 |  Seychelles Seychelles |
0.00267 | 0.0% |
| 151 |  Samoa Samoa |
0.00264 | 0.0% |
| 152 |  Suriname Suriname |
0.00262 | 0.0% |
| 153 |  Niger Niger |
0.00259 | 0.0% |
| 154 |  Pakistan Pakistan |
0.00211 | 0.0% |
| 155 |  Barbados Barbados |
0.00209 | 0.0% |
| 156 |  Solomon Islands Solomon Islands |
0.00172 | 0.0% |
| 157 |  Martinique Martinique |
0.00159 | 0.0% |
| 158 |  Aruba Aruba |
0.00151 | 0.0% |
| 159 |  Guinea-Bissau Guinea-Bissau |
0.00132 | 0.0% |
| 160 |  St. Vincent and the Grenadines St. Vincent and the Grenadines |
0.00119 | 0.0% |
| 161 |  Belize Belize |
0.00106 | 0.0% |
| 162 |  Grenada Grenada |
0.000845 | 0.0% |
| 163 |  St. Kitts and Nevis St. Kitts and Nevis |
0.000687 | 0.0% |
| 164 |  Antigua and Barbuda Antigua and Barbuda |
0.000528 | 0.0% |
| 165 |  Cayman Islands Cayman Islands |
0.000528 | 0.0% |
| 166 |  Cape Verde Cape Verde |
0.000423 | 0.0% |
| 167 |  São Tomé and Príncipe São Tomé and Príncipe |
0.000317 | 0.0% |
| 168 |  Dominica Dominica |
0.000291 | 0.0% |
| 169 |  Bangladesh Bangladesh |
0.000264 | 0.0% |
| 170 |  Vanuatu Vanuatu |
0.000238 | 0.0% |
| 171 |  North Korea North Korea |
0.000211 | 0.0% |
| 172 |  Palestine Palestine |
0.000106 | 0.0% |
| 173 |  South Sudan South Sudan |
0.0000528 | 0.0% |
| 174 |  Gambia Gambia |
0.0000528 | 0.0% |
However, its dominance has declined over time. In 2013, China accounted for 25.7% of global beer production.
The Americas Remain Beer Heavyweights
The United States ranked second with 4.9 billion gallons, followed by Brazil and Mexico.
Together, these three countries brewed more than 12.5 billion gallons in 2024.
The U.S. market remains large, but production fell 4.8% as craft brewery closings outpaced openings for the first time since 2005.
Mexico’s position is also notable. With 3.8 billion gallons brewed, it nearly matched Brazil and remains a major export hub for global beer brands.
Russia Overtakes Germany in Europe
Russia produced 2.4 billion gallons of beer in 2024, moving ahead of Germany to become Europe’s largest beer producer.
This shift reflects major changes in the Russian beer market after several Western brewers exited the country. Carlsberg’s Baltika unit was seized by the state in 2023 and later sold to local management.
Domestic production rose 9% as import substitution supported local brewers. Germany, long associated with beer culture, ranked sixth globally with 2.2 billion gallons.
Africa Posts the Fastest Growth
Africa was the fastest-growing beer region in 2024, with output rising 6.7%.
South Africa remained the continent’s largest beer producer, ranking ninth globally with 977 million gallons. Nigeria also made the top 25, producing 506 million gallons.
Angola stood out with a 35% production surge, reaching 428 million gallons.
Learn More on the Voronoi App 
If you enjoyed today’s post, check out Where Food Inflation Will Hit Hardest in 2026 on Voronoi, the new app from Visual Capitalist.