Ranked: The 50 Largest U.S. Cities by Median Income
See visuals like this from many other data creators on our Voronoi app. Download it for free on iOS or Android and discover incredible data-driven charts from a variety of trusted sources.
Key Takeaways
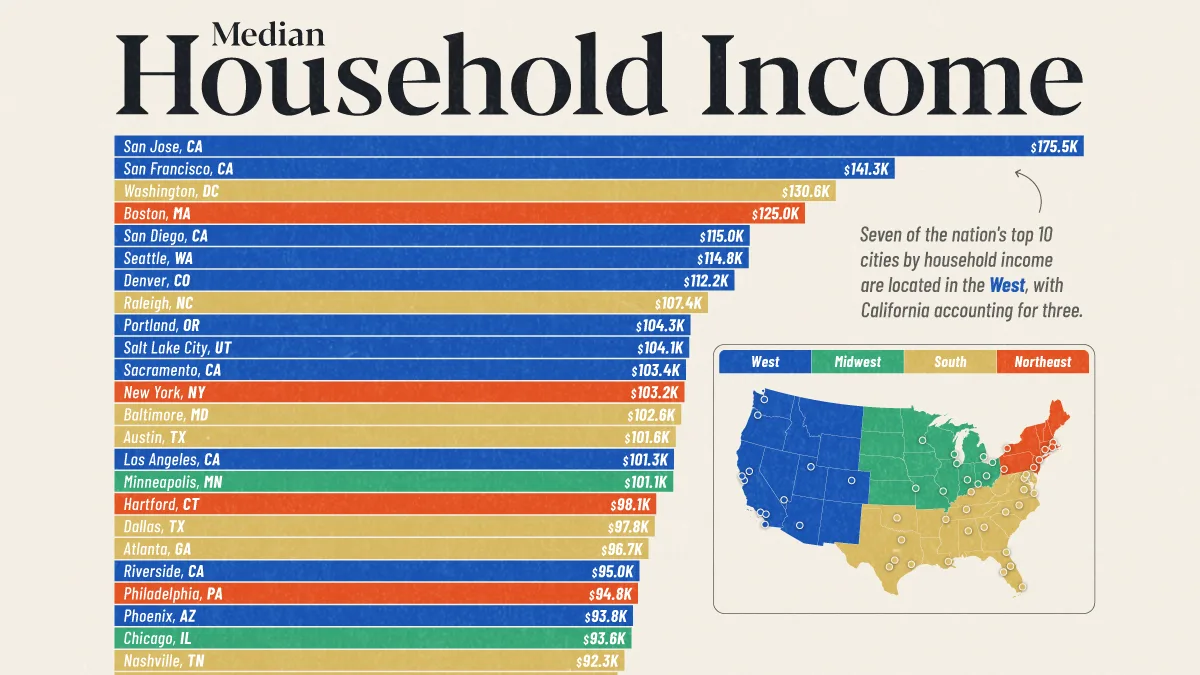
- San Jose ($175,491) and San Francisco ($141,277) have the highest median household incomes among the 50 largest U.S. metro areas.
- Seven of the top 10 highest-income metros are located in the West, including three in California.
- Las Vegas is the only Western metro with a median household income below the national median of $85,828.
Which major U.S. cities have the highest-earning households?
This graphic ranks the 50 most populous metros in the U.S. by median household income, using March 2026 model-estimated data from the Federal Reserve Bank of Atlanta’s Home Ownership Affordability Monitor (HOAM).
The national median household income stands at $85,828, but several major metros far exceed that figure, led by San Jose at nearly $176,000 per year.
California’s Top-Tier Salaries
The West is home to seven of the top 10 highest-ranked U.S. metros by household income, with California accounting for three. For someone pursuing a high salary, the Golden State still stands out despite its high cost of living.
San Jose ($175,491) leads the way, followed by San Francisco ($141,277). Both cities are magnets for tech-sector and highly educated workers seeking Silicon Valley salaries.
The following data table lists U.S. metros based on their median household income.
| Rank | Metro | Median Household Income (2026) |
|---|---|---|
| 1 | San Jose, CA | $175,491 |
| 2 | San Francisco, CA | $141,277 |
| 3 | Washington, DC | $130,587 |
| 4 | Boston, MA | $125,025 |
| 5 | San Diego, CA | $115,012 |
| 6 | Seattle, WA | $114,804 |
| 7 | Denver, CO | $112,231 |
| 8 | Raleigh, NC | $107,446 |
| 9 | Portland, OR | $104,269 |
| 10 | Salt Lake City, UT | $104,059 |
| 11 | Sacramento, CA | $103,447 |
| 12 | New York, NY | $103,166 |
| 13 | Baltimore, MD | $102,578 |
| 14 | Austin, TX | $101,583 |
| 15 | Los Angeles, CA | $101,268 |
| 16 | Minneapolis, MN | $101,123 |
| 17 | Hartford, CT | $98,059 |
| 18 | Dallas, TX | $97,808 |
| 19 | Atlanta, GA | $96,651 |
| 20 | Riverside, CA | $95,039 |
| 21 | Philadelphia, PA | $94,766 |
| 22 | Phoenix, AZ | $93,845 |
| 23 | Chicago, IL | $93,572 |
| 24 | Nashville, TN | $92,333 |
| 25 | Charlotte, NC | $91,059 |
| 26 | Kansas City, MO | $88,033 |
| 27 | Columbus, OH | $87,273 |
| 28 | Virginia Beach, VA | $86,046 |
| 29 | Orlando, FL | $84,866 |
| 30 | Jacksonville, FL | $84,841 |
| 31 | Miami, FL | $84,814 |
| 32 | Houston, TX | $84,610 |
| 33 | Cincinnati, OH | $84,546 |
| 34 | St. Louis, MO | $84,425 |
| 35 | Las Vegas, NV | $83,859 |
| 36 | Richmond, VA | $83,637 |
| 37 | Tampa, FL | $82,721 |
| 38 | Providence, RI | $82,527 |
| 39 | San Antonio, TX | $82,130 |
| 40 | Pittsburgh, PA | $81,967 |
| 41 | Indianapolis, IN | $81,718 |
| 42 | Milwaukee, WI | $80,485 |
| 43 | Birmingham, AL | $79,463 |
| 44 | Detroit, MI | $79,294 |
| 45 | Louisville, KY | $77,221 |
| 46 | Oklahoma City, OK | $76,960 |
| 47 | Cleveland, OH | $76,118 |
| 48 | Buffalo, NY | $74,258 |
| 49 | Memphis, TN | $70,056 |
| 50 | New Orleans, LA | $65,021 |
| — | United States | $85,828 |
San Diego ($115,012) lands in the top five, while nearby Los Angeles ($101,268) and Riverside ($95,039) also fall above the national median household income.
The Midwest: Incomes at All Levels
The West can claim the highest incomes, with Las Vegas ($83,859) as the region’s only major metro to fall below the national average. The Midwest shows a wider range of outcomes.
Although not home to any of the country’s top-10 metro areas, the Midwest includes higher-income cities such as Minneapolis ($101,123) and Chicago ($93,572), as well as lower-median deindustrializing cities such as Cleveland ($76,118) and Detroit ($79,294).
The distinction between these groups often comes down to the industries present in each metro area. Chicago, for example, has been cited by sources such as Moody’s as having the most balanced economy of any major U.S. city, with no single industry employing over 14% of the labor force. This sectoral diversity has helped consistently attract top talent.
The Northeast’s Educational Edge
Median incomes are particularly high in dynamic northeastern cities such as Boston ($125,025) and New York ($103,166), both of which are major metropolitan economies with diverse workforces.
Education plays a key role: Boston is near top-tier universities such as Harvard University and the Massachusetts Institute of Technology, while New York is home to world-class colleges such as Columbia University and New York University.
Similar to the role Stanford played in the development of Silicon Valley, these prestigious northeastern universities have helped nearby cities become hubs for educated talent, raising median incomes accordingly.
Learn More on the Voronoi App 
Wondering how far these incomes go toward buying a house? Check out The States Where Housing Prices Have Surged the Most (2021–2026) on Voronoi, the new app from Visual Capitalist.