Mapped: Birth Rates Are Falling Even Among Women in Their 30s
See visuals like this from many other data creators on our Voronoi app. Download it for free on iOS or Android and discover incredible data-driven charts from a variety of trusted sources.
Key Takeaways
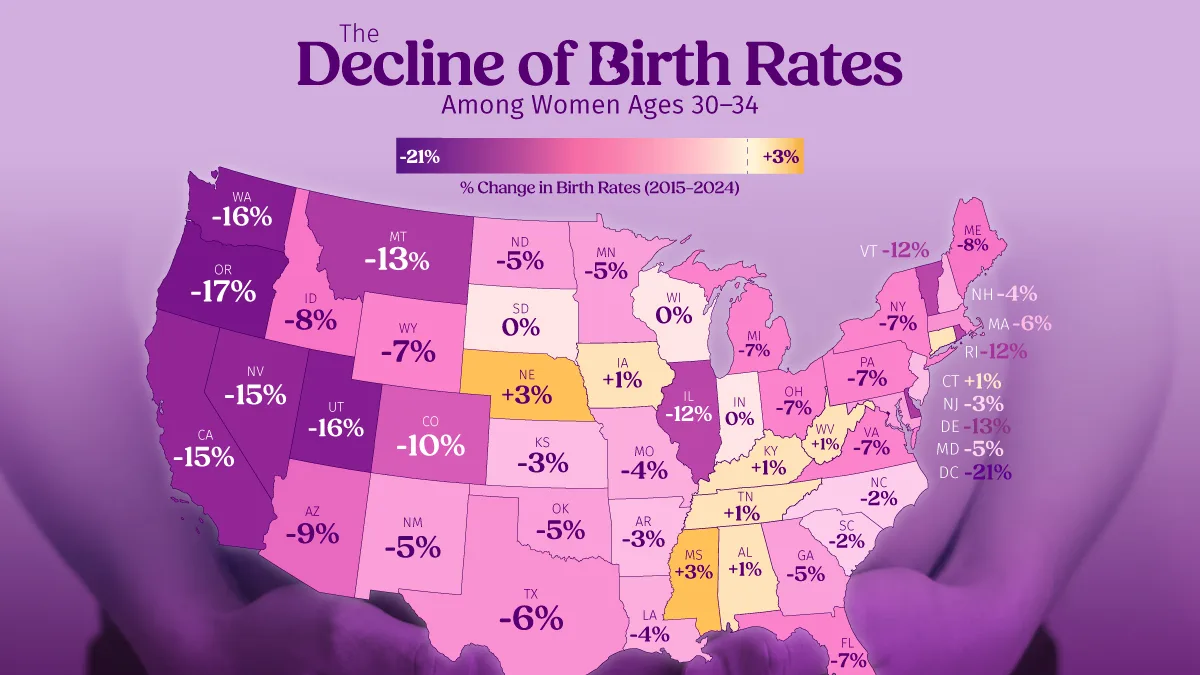
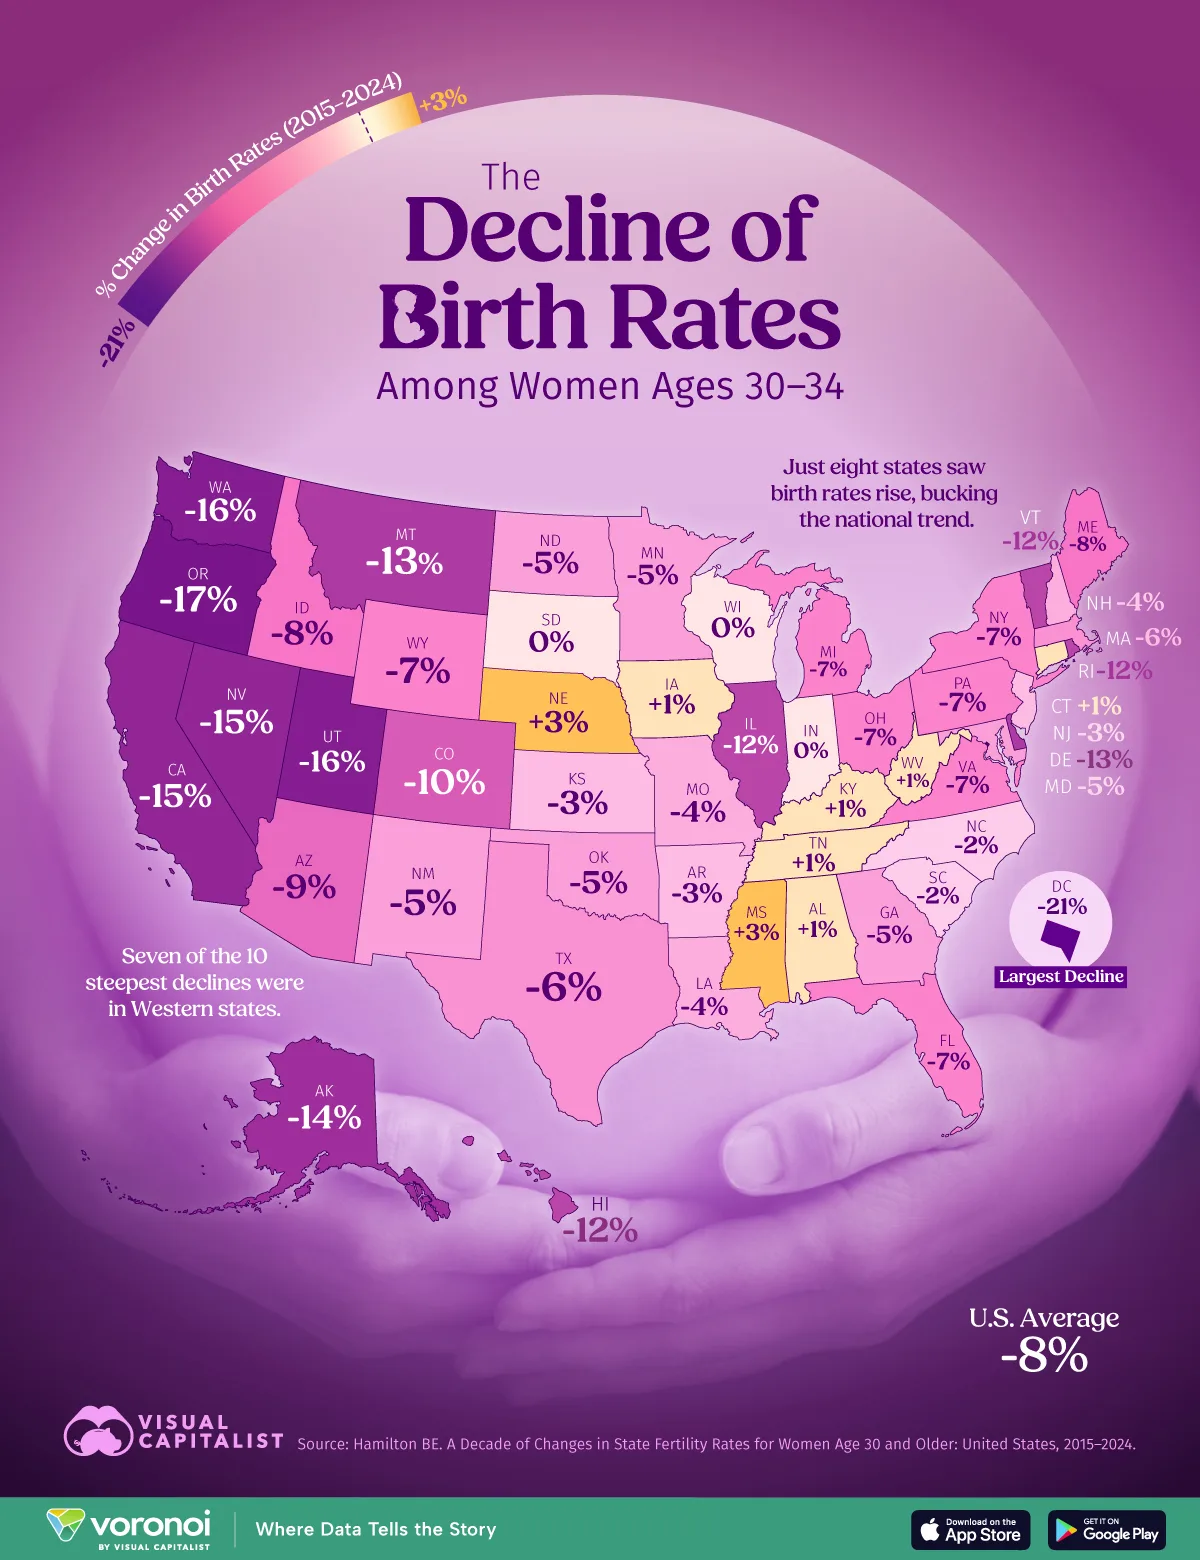
- Birth rates among women ages 30–34 fell in 39 states between 2015 and 2024, with the U.S. average down 8%.
- Seven of the 10 largest declines were in Western states.
- The slowdown comes even as births increasingly shift toward women in their late 30s and 40s.
America’s birth slowdown is no longer limited to younger adults. Even women ages 30–34, traditionally one of the country’s peak childbearing groups, are having fewer children across most of the U.S.
This map uses new research based on data from the National Center for Health Statistics to show how birth rates among women ages 30–34 changed across America between 2015 and 2024.
The States Leading the Decline in Birth Rates
Nearly half of 30-year-old American women are now childless, up from just 18% in 1976. That doesn’t necessarily mean they will never have children, but it highlights how dramatically family formation has shifted toward later ages over the past several decades.
Today’s 30-year-olds are reaching many traditional milestones later than previous generations. The median first-time homebuyer is now 35 years old, while the age of first marriage has climbed steadily for decades. As those timelines shift, parenthood often shifts with them.
| State | Births per 1,000 Women 2015 |
Births per 1,000 Women 2024 |
% Change |
|---|---|---|---|
| District of Columbia | 76.0 | 60.1 | -21% |
| Oregon | 94.2 | 78.4 | -17% |
| Washington | 124.3 | 104.8 | -16% |
| Utah | 105.5 | 88.4 | -16% |
| California | 105.5 | 89.4 | -15% |
| Nevada | 93.1 | 79.6 | -15% |
| Alaska | 108.4 | 93.0 | -14% |
| Delaware | 108.7 | 94.4 | -13% |
| Montana | 103.4 | 90.4 | -13% |
| Vermont | 103.1 | 91.2 | -12% |
| Rhode Island | 105.6 | 93.3 | -12% |
| Illinois | 102.7 | 90.7 | -12% |
| Hawaii | 94.1 | 82.8 | -12% |
| Colorado | 100.1 | 89.7 | -10% |
| Arizona | 98.4 | 89.2 | -9% |
| Maine | 107.0 | 98.4 | -8% |
| Idaho | 92.8 | 85.4 | -8% |
| Pennsylvania | 97.2 | 90.3 | -7% |
| Ohio | 101.2 | 94.1 | -7% |
| Florida | 101.1 | 93.6 | -7% |
| New York | 101.8 | 94.3 | -7% |
| Virginia | 105.2 | 98.3 | -7% |
| Michigan | 105.9 | 98.2 | -7% |
| Wyoming | 94.4 | 87.6 | -7% |
| Massachusetts | 109.5 | 102.4 | -6% |
| Texas | 102.0 | 96.0 | -6% |
| Minnesota | 93.7 | 89.0 | -5% |
| Maryland | 106.5 | 100.7 | -5% |
| North Dakota | 121.3 | 114.8 | -5% |
| Georgia | 82.5 | 78.7 | -5% |
| New Mexico | 117.1 | 111.1 | -5% |
| Oklahoma | 90.0 | 85.3 | -5% |
| New Hampshire | 89.1 | 85.7 | -4% |
| Missouri | 96.8 | 93.4 | -4% |
| Louisiana | 103.7 | 99.5 | -4% |
| New Jersey | 84.7 | 82.0 | -3% |
| Arkansas | 105.2 | 102.5 | -3% |
| Kansas | 115.3 | 112.4 | -3% |
| South Carolina | 96.8 | 94.8 | -2% |
| North Carolina | 93.0 | 90.7 | -2% |
| Indiana | 96.9 | 96.9 | 0% |
| Wisconsin | 122.4 | 122.5 | 0% |
| South Dakota | 107.1 | 106.7 | 0% |
| Alabama | 85.6 | 86.1 | 1% |
| Tennessee | 106.9 | 108.5 | 1% |
| Connecticut | 108.2 | 109.5 | 1% |
| Kentucky | 87.8 | 88.7 | 1% |
| Iowa | 88.7 | 89.4 | 1% |
| West Virginia | 76.3 | 77.0 | 1% |
| Mississippi | 78.0 | 80.0 | 3% |
| Nebraska | 116.0 | 118.9 | 3% |
 U.S. Average U.S. Average |
101.4 | 93.7 | -8% |
Washington, D.C. recorded the steepest decline in birth rates among women ages 30–34, down 21% over the period. Oregon, Washington, and Utah followed close behind, while seven of the 10 largest declines occurred in Western states.
By contrast, Indiana, South Dakota, and Wisconsin saw virtually no change.
The States Bucking the National Trend
Only eight states recorded higher birth rates among women ages 30–34 in 2024 than in 2015.
Nebraska and Mississippi recorded the largest increases, with birth rates rising 3% over the period. The states posting gains were concentrated almost entirely in the South and Midwest, with Connecticut standing as the exception.
Many of the states posting gains also tend to have lower housing costs than large coastal markets. While many factors influence fertility, including education, migration, and local demographics, affordability pressures are often cited as one reason families delay having children.
The pattern suggests that the economics of starting a family may be diverging across America, with some regions proving more supportive of family formation than others.
Births Are Rising for Women in Their 40s
The declines among women in their early 30s don’t mean births are disappearing altogether. Instead, they’re increasingly shifting to older ages.
Birth rates rose 5% among women ages 35–39 and 24% among women ages 40–49 over the same period. The contrast suggests the long-running trend toward later parenthood is continuing, although delayed childbearing no longer fully offsets the broader slowdown in births.
Learn More on the Voronoi App 
To learn more about this topic, check out this graphic on the global fertility divide.