Mapped: The Global Fertility Divide
Key Takeaways
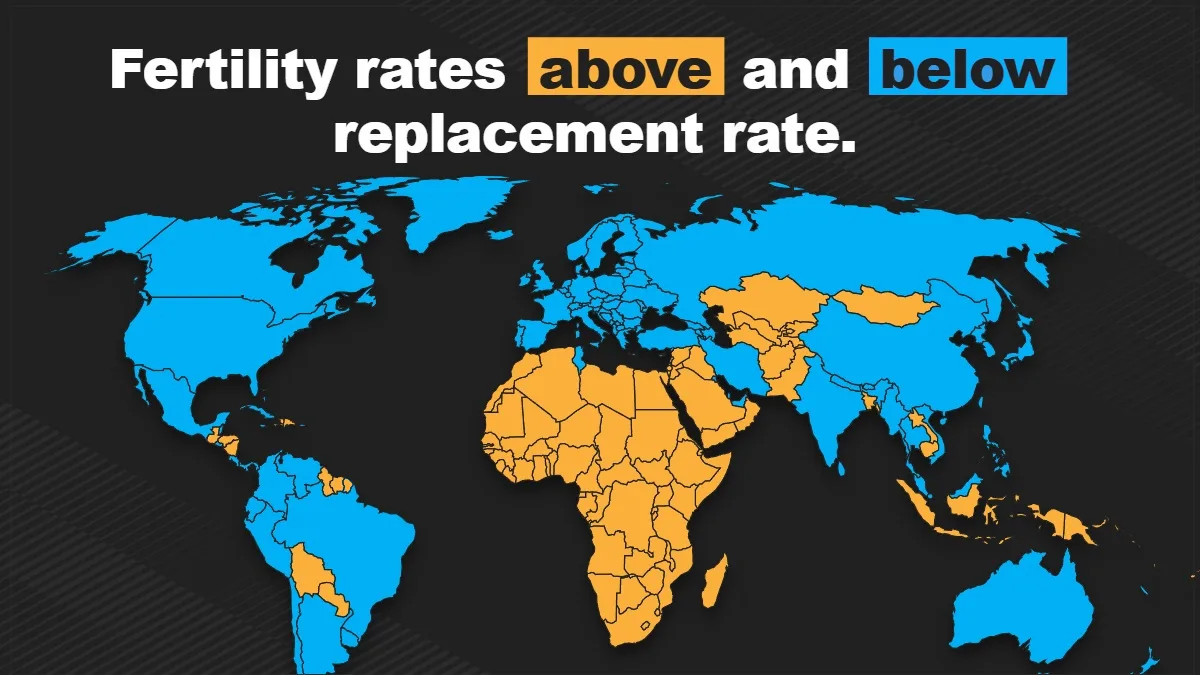
- Just 43% of the world’s countries have fertility rates above the replacement threshold of 2.1 children per woman.
- Europe, East Asia, and most of the Americas are now below replacement, while most African countries remain above it.
- A handful of countries, from Tunisia to Guatemala, stand out as exceptions to their regional trends.
The world is becoming increasingly divided by fertility.
One group of countries now has too few births to naturally replace its population, while another continues to see population growth driven by higher fertility rates. This demographic divide has major implications for aging populations, labor markets, immigration, and future economic growth.
This map shows which countries are above and below the replacement fertility rate of 2.1 children per woman, using projections for 2025 from the UN World Population Prospects 2024 Revision.
While the regional patterns are striking, several countries buck the trend.
Fertility Rates by Country
The table below lists projected fertility rates for 2025 and whether each country falls above or below the 2.1 replacement threshold.
| Country | Total Fertility Rate (TFR) | Above or Below 2.1 (Replacement Rate) |
|---|---|---|
| Chad | 5.94 | Above |
| Somalia | 5.91 | Above |
| DR Congo | 5.90 | Above |
| Central African Republic | 5.81 | Above |
| Niger | 5.79 | Above |
| Mali | 5.42 | Above |
| Angola | 4.95 | Above |
| Burundi | 4.68 | Above |
| Afghanistan | 4.66 | Above |
| Mozambique | 4.62 | Above |
| Mauritania | 4.56 | Above |
| Mayotte | 4.50 | Above |
| Tanzania | 4.47 | Above |
| Benin | 4.42 | Above |
| Yemen | 4.41 | Above |
| Nigeria | 4.30 | Above |
| Sudan | 4.19 | Above |
| Cameroon | 4.19 | Above |
| Ivory Coast | 4.17 | Above |
| Togo | 4.07 | Above |
| Uganda | 4.06 | Above |
| Congo | 4.05 | Above |
| Guinea | 4.04 | Above |
| Equatorial Guinea | 4.04 | Above |
| Burkina Faso | 4.00 | Above |
| Zambia | 3.97 | Above |
| Madagascar | 3.84 | Above |
| Ethiopia | 3.81 | Above |
| Gambia | 3.80 | Above |
| Liberia | 3.79 | Above |
| Comoros | 3.76 | Above |
| Samoa | 3.75 | Above |
| Senegal | 3.71 | Above |
| South Sudan | 3.71 | Above |
| Guinea-Bissau | 3.68 | Above |
| Zimbabwe | 3.62 | Above |
| Sierra Leone | 3.61 | Above |
| Eritrea | 3.61 | Above |
| Rwanda | 3.59 | Above |
| Gabon | 3.54 | Above |
| Malawi | 3.53 | Above |
| Vanuatu | 3.53 | Above |
| Sao Tome and Principe | 3.53 | Above |
| Pakistan | 3.50 | Above |
| Solomon Islands | 3.47 | Above |
| Uzbekistan | 3.45 | Above |
| Ghana | 3.30 | Above |
| French Guiana | 3.29 | Above |
| Nauru | 3.25 | Above |
| Palestine | 3.19 | Above |
| Iraq | 3.17 | Above |
| Namibia | 3.17 | Above |
| Tuvalu | 3.14 | Above |
| Kenya | 3.12 | Above |
| Kiribati | 3.09 | Above |
| Tonga | 3.07 | Above |
| Papua New Guinea | 3.03 | Above |
| Tajikistan | 2.99 | Above |
| Kazakhstan | 2.95 | Above |
| Marshall Islands | 2.82 | Above |
| Israel | 2.75 | Above |
| Kyrgyzstan | 2.75 | Above |
| Egypt | 2.71 | Above |
| Guam | 2.71 | Above |
| Micronesia | 2.71 | Above |
| Eswatini | 2.68 | Above |
| Algeria | 2.67 | Above |
| Syria | 2.66 | Above |
| Botswana | 2.66 | Above |
| Lesotho | 2.64 | Above |
| Turkmenistan | 2.63 | Above |
| Saint Martin (French part) | 2.63 | Above |
| Haiti | 2.59 | Above |
| Mongolia | 2.58 | Above |
| Djibouti | 2.58 | Above |
| Jordan | 2.57 | Above |
| Tokelau | 2.57 | Above |
| Timor-Leste | 2.56 | Above |
| Cambodia | 2.51 | Above |
| Bolivia | 2.50 | Above |
| Oman | 2.48 | Above |
| Niue | 2.46 | Above |
| Honduras | 2.45 | Above |
| Paraguay | 2.39 | Above |
| Guyana | 2.37 | Above |
| Laos | 2.36 | Above |
| Saudi Arabia | 2.29 | Above |
| Northern Mariana Islands | 2.28 | Above |
| Guatemala | 2.26 | Above |
| Libya | 2.25 | Above |
| Fiji | 2.25 | Above |
| American Samoa | 2.25 | Above |
| Lebanon | 2.21 | Above |
| Suriname | 2.21 | Above |
| Faroe Islands | 2.20 | Above |
| South Africa | 2.19 | Above |
| Dominican Republic | 2.19 | Above |
| Morocco | 2.18 | Above |
| Nicaragua | 2.18 | Above |
| Western Sahara | 2.15 | Above |
| Réunion | 2.13 | Above |
| Bangladesh | 2.11 | Above |
| Indonesia | 2.10 | Above |
| Panama | 2.09 | Below |
| Monaco | 2.09 | Below |
| Myanmar | 2.08 | Below |
| Seychelles | 2.08 | Below |
| United States Virgin Islands | 2.07 | Below |
| Venezuela | 2.06 | Below |
| Guadeloupe | 2.05 | Below |
| Belize | 2.01 | Below |
| Cook Islands | 2.00 | Below |
| Martinique | 1.97 | Below |
| New Caledonia | 1.95 | Below |
| India | 1.94 | Below |
| Peru | 1.94 | Below |
| Nepal | 1.94 | Below |
| Sri Lanka | 1.94 | Below |
| Greenland | 1.91 | Below |
| Philippines | 1.88 | Below |
| Vietnam | 1.88 | Below |
| Gibraltar | 1.88 | Below |
| Mexico | 1.87 | Below |
| Palau | 1.86 | Below |
| Tunisia | 1.80 | Below |
| Montenegro | 1.80 | Below |
| Ecuador | 1.79 | Below |
| Georgia | 1.79 | Below |
| Bahrain | 1.78 | Below |
| Dem. People’s Republic of Korea | 1.77 | Below |
| El Salvador | 1.75 | Below |
| St. Vincent & Grenadines | 1.75 | Below |
| Bulgaria | 1.74 | Below |
| Moldova | 1.72 | Below |
| Romania | 1.71 | Below |
| Armenia | 1.71 | Below |
| Brunei | 1.71 | Below |
| Qatar | 1.70 | Below |
| Barbados | 1.70 | Below |
| Falkland Islands | 1.69 | Below |
| Iran | 1.67 | Below |
| Azerbaijan | 1.66 | Below |
| New Zealand | 1.65 | Below |
| France | 1.64 | Below |
| Australia | 1.64 | Below |
| St. Helena | 1.64 | Below |
| United States | 1.62 | Below |
| Turkey | 1.62 | Below |
| Colombia | 1.62 | Below |
| Aruba | 1.61 | Below |
| Brazil | 1.60 | Below |
| Ireland | 1.60 | Below |
| Slovenia | 1.58 | Below |
| Antigua and Barbuda | 1.58 | Below |
| Slovakia | 1.57 | Below |
| Maldives | 1.55 | Below |
| United Kingdom | 1.54 | Below |
| Liechtenstein | 1.54 | Below |
| Malaysia | 1.53 | Below |
| Kosovo (under UNSC res. 1244) | 1.53 | Below |
| Isle of Man | 1.53 | Below |
| Portugal | 1.52 | Below |
| Denmark | 1.52 | Below |
| Trinidad and Tobago | 1.52 | Below |
| Cayman Islands | 1.51 | Below |
| St. Kitts & Nevis | 1.51 | Below |
| Argentina | 1.50 | Below |
| Hungary | 1.50 | Below |
| Serbia | 1.50 | Below |
| Kuwait | 1.50 | Below |
| Bosnia and Herzegovina | 1.50 | Below |
| Cape Verde | 1.50 | Below |
| Iceland | 1.50 | Below |
| French Polynesia | 1.48 | Below |
| Czechia | 1.47 | Below |
| Croatia | 1.47 | Below |
| North Macedonia | 1.47 | Below |
| Dominica | 1.47 | Below |
| Russia | 1.46 | Below |
| Germany | 1.46 | Below |
| Grenada | 1.46 | Below |
| Cuba | 1.45 | Below |
| Bonaire | 1.45 | Below |
| Montserrat | 1.45 | Below |
| Netherlands | 1.44 | Below |
| Sweden | 1.44 | Below |
| Switzerland | 1.44 | Below |
| Bhutan | 1.44 | Below |
| Turks and Caicos Islands | 1.44 | Below |
| Sint Maarten | 1.43 | Below |
| Norway | 1.42 | Below |
| Bermuda | 1.41 | Below |
| Luxembourg | 1.40 | Below |
| Wallis & Futuna | 1.40 | Below |
| Belgium | 1.39 | Below |
| Uruguay | 1.39 | Below |
| St. Lucia | 1.38 | Below |
| Jersey | 1.38 | Below |
| Cyprus | 1.37 | Below |
| Estonia | 1.37 | Below |
| Guernsey | 1.37 | Below |
| Bahamas | 1.36 | Below |
| Latvia | 1.35 | Below |
| Anguilla | 1.35 | Below |
| Greece | 1.34 | Below |
| Jamaica | 1.34 | Below |
| Canada | 1.33 | Below |
| Austria | 1.33 | Below |
| Albania | 1.33 | Below |
| Poland | 1.31 | Below |
| Costa Rica | 1.31 | Below |
| Finland | 1.30 | Below |
| Saint Pierre and Miquelon | 1.28 | Below |
| Japan | 1.23 | Below |
| Spain | 1.23 | Below |
| Belarus | 1.22 | Below |
| Lithuania | 1.22 | Below |
| Italy | 1.21 | Below |
| United Arab Emirates | 1.21 | Below |
| Mauritius | 1.21 | Below |
| Thailand | 1.19 | Below |
| San Marino | 1.16 | Below |
| Chile | 1.13 | Below |
| Malta | 1.11 | Below |
| Andorra | 1.10 | Below |
| Curacao | 1.07 | Below |
| British Virgin Islands | 1.06 | Below |
| China | 1.02 | Below |
| Ukraine | 1.00 | Below |
| Singapore | 0.96 | Below |
| Puerto Rico | 0.94 | Below |
| Taiwan | 0.86 | Below |
| St. Barthélemy | 0.83 | Below |
| South Korea | 0.75 | Below |
| Hong Kong | 0.74 | Below |
| Macao | 0.69 | Below |
The Great Fertility Divide
The divide is strikingly regional.
Europe is entirely below replacement fertility, joined by most countries across the Americas and East Asia. Meanwhile, most African countries, along with parts of the Middle East, Central Asia, and Southeast Asia, remain above the replacement threshold.
The map also reveals several notable exceptions.
Geographic Pockets That Buck the Trend
While regional patterns are remarkably consistent, several countries stand out as exceptions to their neighbors:
- Central America: Honduras, Nicaragua, and Guatemala all have fertility rates just over replacement. On both the north and south sides, virtually every other country in the Americas is below replacement.
- Africa: Tunisia is the sole country in continental Africa with a rate under 2.1.
- South America: There are two pockets of higher fertility: Peru and Paraguay, and the Guianas (Guyana, Suriname, and French Guiana).
- Middle East: UAE, Qatar, and Bahrain are below 2.1, while surrounding nations in virtually every direction are above replacement.
- South/Central Asia: A strip of connected countries, from Pakistan all the way up through Kazakhstan to Mongolia, has higher fertility. Bangladesh also stands out as higher fertility.
- Southeast Asia: Laos and Cambodia stand out as above replacement. Indonesia is the only country with exactly a 2.1 fertility rate, equal to replacement.
Most of these outliers are countries at different stages of the demographic transition than their neighbors.
Their fertility rates remain above or below replacement while surrounding countries have already moved in the other direction, creating pockets that stand apart from the broader regional pattern.
Learn More on the Voronoi App 
If you enjoyed today’s post, see Japan’s birthrate collapse over the last 60 years in this visualization on Voronoi.