The World’s Largest Economies in 2026: Nominal vs PPP
See visuals like this from many other data creators on our Voronoi app. Download it for free on iOS or Android and discover incredible data-driven charts from a variety of trusted sources.
Key Takeaways
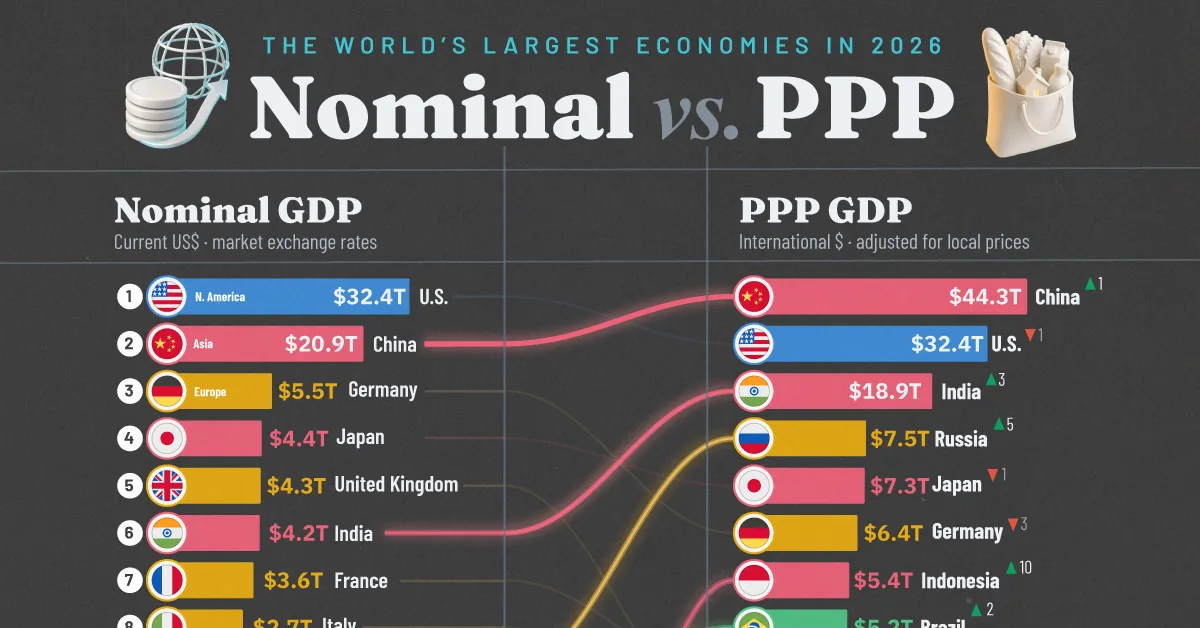
- China ranks as the world’s largest economy by purchasing power parity (PPP), while the U.S. remains No. 1 by nominal GDP.
- Adjusting for local prices reshuffles the rankings, lifting countries like India, Russia, and Indonesia.
- These rankings are based on IMF projections for the world’s 20 largest economies in 2026.
Is the world’s biggest economy the United States or China The answer depends on how you measure GDP.
This graphic compares the world’s 20 largest economies in 2026 using International Monetary Fund World Economic Outlook projections.
It ranks countries by both nominal GDP, which measures output at current market exchange rates, and purchasing power parity (PPP), which adjusts for differences in local prices and cost of living.
The U.S. and China: Vying for #1
Nominal GDP is the standard measure used to compare economies globally because it reflects output at current market exchange rates. By this measure, the United States remains the world’s largest economy, with projected output of $32.4 trillion in 2026.
This data table ranks countries by their projected nominal GDP in 2026.
| Rank | Country | Nominal GDP (trllions $) |
|---|---|---|
| 1 |  United States United States |
32.4 |
| 2 |  China China |
20.9 |
| 3 |  Germany Germany |
5.5 |
| 4 |  Japan Japan |
4.4 |
| 5 |  United Kingdom United Kingdom |
4.3 |
| 6 |  India India |
4.2 |
| 7 |  France France |
3.6 |
| 8 |  Italy Italy |
2.7 |
| 9 |  Russia Russia |
2.7 |
| 10 |  Brazil Brazil |
2.6 |
| 11 |  Canada Canada |
2.5 |
| 12 |  Australia Australia |
2.1 |
| 13 |  Mexico Mexico |
2.1 |
| 14 |  Spain Spain |
2.1 |
| 15 |  South Korea South Korea |
1.9 |
| 16 |  Türkiye Türkiye |
1.6 |
| 17 |  Indonesia Indonesia |
1.5 |
| 18 |  Netherlands Netherlands |
1.4 |
| 19 |  Saudi Arabia Saudi Arabia |
1.4 |
| 20 |  Switzerland Switzerland |
1.1 |
Following the U.S. is China at $20.9 trillion, with Germany in a distant third at $5.5 trillion.
China’s rapid industrialization and export-led growth transformed it into the world’s second-largest economy by nominal GDP, overtaking Germany in 2007 and Japan in 2010.
However, when adjusting for differences in cost of living, China surpassed the U.S. by PPP-adjusted GDP in 2014.
The Purchasing Power Adjustment
China’s PPP-adjusted economy sits at $44.3 trillion in 2026, over $10 trillion more than the U.S. at $32.4 trillion.
This adjustment reflects the large differences in local prices between countries. A dollar of output in the U.S. buys less than that same dollar of output in a country like China or India, the latter of which has the world’s third-largest GDP when adjusted for purchasing power.
| Rank | Country | PPP-adjusted GDP (trillions $) |
|---|---|---|
| 1 | China |
44.3 |
| 2 | United States |
32.4 |
| 3 | India |
18.9 |
| 4 | Russia |
7.5 |
| 5 | Japan |
7.3 |
| 6 | Germany |
6.4 |
| 7 | Indonesia |
5.4 |
| 8 | Brazil |
5.2 |
| 9 | France |
4.7 |
| 10 | United Kingdom |
4.7 |
| 11 | Türkiye |
4 |
| 12 | Italy |
3.9 |
| 13 | Mexico |
3.6 |
| 14 | South Korea |
3.5 |
| 15 | Spain |
3 |
| 16 | Canada |
2.9 |
| 17 | Saudi Arabia |
2.9 |
| 18 |  Egypt Egypt |
2.6 |
| 19 |  Nigeria Nigeria |
2.4 |
| 20 |  Taiwan Taiwan |
2.3 |
Developing countries like China and India are boosted in the global rankings because of their lower costs of living compared to more developed economies. As a result, some of the world’s largest economies by nominal GDP fall off the top-20 list entirely.
The Biggest Winners and Losers
Russia ($7.5 trillion) goes from Europe’s fifth-largest economy by nominal GDP to its largest when adjusting for purchasing power. While larger economies like France, Germany, and the United Kingdom also see a boost compared to their nominal GDP, this is small compared to Russia’s near-tripling of output value.
Indonesia ($5.4 trillion) sees the largest change in ranking. Adjusting for purchasing power makes the massive Southeast Asian island country jump 10 spots, from 17th to seventh.
PPP rankings highlight where goods and services can be produced or purchased more cheaply, making them useful for comparing domestic economic activity and living standards.
Nominal GDP, however, remains the preferred measure for assessing financial market size, international trade, and global economic influence.
Looking at both together provides a more complete picture of the world’s largest economies.
Learn More on the Voronoi App 
Curious how the U.S. is faring against its rivals in PPP-adjusted metrics? Check out U.S. Share of GDP (PPP) Rises Among Advanced Economies, Declines Globally on Voronoi, the new app from Visual Capitalist.