Visualizing Every El Niño and La Niña Since 1979
This was originally posted on our Voronoi app. Download the app for free on iOS or Android and discover incredible data-driven charts from a variety of trusted sources.
Key Takeaways
- The ENSO record since 1979 includes 17 El Niño, 19 La Niña, and 12 neutral winter seasons.
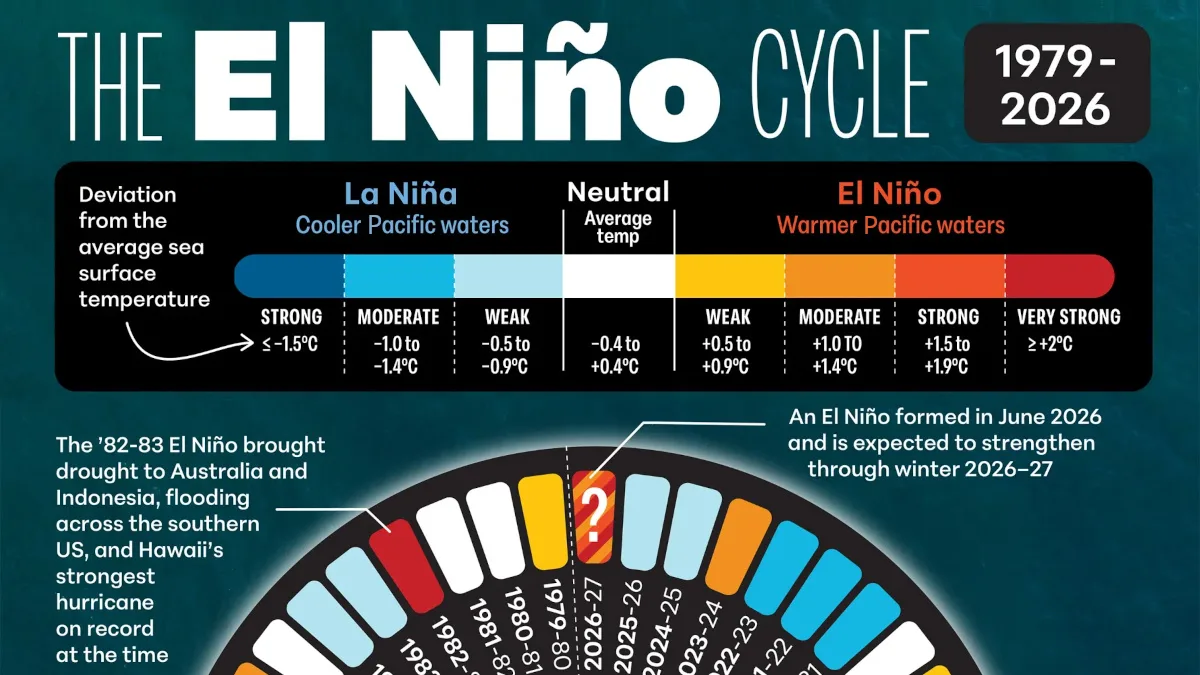
- NOAA says a new El Niño developed in June 2026 and is expected to strengthen through the 2026-27 winter.
- The strongest El Niño events have coincided with major droughts, floods, marine heat stress, and record global temperatures.
El Niño is one of Earth’s most closely watched climate patterns because even modest changes in Pacific Ocean temperatures can reshape weather around the world.
This visualization tracks every Northern Hemisphere winter ENSO phase from 1979-80 through the forecast 2026-27 season, highlighting nearly five decades of alternating El Niño, La Niña, and neutral conditions.
Created by Julie R. Peasley using data from Golden Gate Weather Services, the National Centers for Environmental Information, and NOAA, the graphic places the developing 2026 El Niño into historical context alongside some of the strongest events on record.
Nearly Five Decades of El Niño and La Niña Cycles
From 1979-80 through the forecast 2026-27 season, the Pacific has alternated between warmer, cooler, and neutral conditions. The full winter-by-winter dataset is shown below.
| Year (Winter Season) | Type | Intensity |
|---|---|---|
| 2026-27 | El Niño | Unknown but forecasted to be Strong |
| 2025-26 | La Niña | Weak |
| 2024-25 | La Niña | Weak |
| 2023-24 | El Niño | Moderate |
| 2022-23 | La Niña | Moderate |
| 2021-22 | La Niña | Moderate |
| 2020-21 | La Niña | Moderate |
| 2019-20 | Neutral | – |
| 2018-19 | El Niño | Weak |
| 2017-18 | La Niña | Moderate |
| 2016-17 | La Niña | Moderate |
| 2015-16 | El Niño | Very Strong |
| 2014-15 | El Niño | Weak |
| 2013-14 | Neutral | – |
| 2012-13 | Neutral | – |
| 2011-12 | La Niña | Weak |
| 2010-11 | La Niña | Strong |
| 2009-10 | El Niño | Moderate |
| 2008-09 | La Niña | Weak |
| 2007-08 | La Niña | Strong |
| 2006-07 | El Niño | Weak |
| 2005-06 | La Niña | Weak |
| 2004-05 | El Niño | Weak |
| 2003-04 | Neutral | – |
| 2002-03 | El Niño | Moderate |
| 2001-02 | Neutral | – |
| 2000-01 | La Niña | Weak |
| 1999-00 | La Niña | Strong |
| 1998-99 | La Niña | Strong |
| 1997-98 | El Niño | Very Strong |
| 1996-97 | Neutral | – |
| 1995-96 | La Niña | Weak |
| 1994-95 | El Niño | Moderate |
| 1993-94 | Neutral | – |
| 1992-93 | El Niño | Weak |
| 1991-92 | El Niño | Very Strong |
| 1990-91 | Neutral | – |
| 1989-90 | Neutral | – |
| 1988-89 | La Niña | Strong |
| 1987-88 | El Niño | Moderate |
| 1986-87 | El Niño | Moderate |
| 1985-86 | Neutral | – |
| 1984-85 | La Niña | Weak |
| 1983-84 | La Niña | Weak |
| 1982-83 | El Niño | Very Strong |
| 1981-82 | Neutral | – |
| 1980-81 | Neutral | – |
| 1979-80 | El Niño | Weak |
Although La Niña has occurred slightly more often since 1979, the strongest El Niño episodes have generally produced the most widespread global impacts. This highlights that an event’s intensity often matters more than how frequently it occurs.
The ENSO phases shown in the visualization are based on tropical Pacific sea surface temperature anomalies. Neutral conditions range from roughly -0.4°C to +0.4°C, while El Niño begins above +0.5°C and reaches the “very strong” category at +2.0°C or higher.
The El Niño Events Shaping Modern Climate History
Several El Niño episodes stand out for their global consequences. The 1982-83 event brought severe drought across Australia and Indonesia while triggering flooding across parts of the southern United States. It also fueled Hawaii’s strongest hurricane on record at the time.
The 1997-98 “super” El Niño became one of the strongest ever observed, contributing to floods, droughts, and wildfires across multiple continents. Record ocean heat during that event is estimated to have killed roughly 16% of the world’s coral reefs.
More recently, the powerful 2015-16 El Niño coincided with record global temperatures, destructive North Pacific hurricanes, Indonesian wildfires, drought in Ethiopia and parts of the Caribbean, and the largest annual increase in atmospheric CO₂ measured at the time. These climate swings also help explain longer-term shifts in global emissions.
What Is Happening in 2026?
According to NOAA, a new El Niño officially developed during June 2026 after tropical Pacific waters warmed beyond the threshold for El Niño conditions. Forecasters expect the event to strengthen through the 2026-27 Northern Hemisphere winter, although its ultimate intensity remains uncertain.
El Niño does not cause the same weather everywhere, but it raises the likelihood of climate extremes across many regions. NOAA and the World Meteorological Organization say the developing 2026 event could influence heat, rainfall, and storm patterns through the coming Northern Hemisphere winter, with impacts varying by location.
With oceans already experiencing exceptional warmth, scientists are watching closely to see whether this latest El Niño amplifies global temperatures further during late 2026 and into 2027.
Learn More on the Voronoi App 
If you’re interested in how climate patterns translate into real-world economic impacts, check out U.S. Climate Disasters Have Cost Nearly $1 Trillion So Far This Decade on the Voronoi app, where you’ll find more data-driven visualizations covering weather, climate, and the environment.