Mapped: Which Countries Spend the Most on Education?
This was originally posted on our Voronoi app. Download the app for free on iOS or Android and discover incredible data-driven charts from a variety of trusted sources.
Key Takeaways:
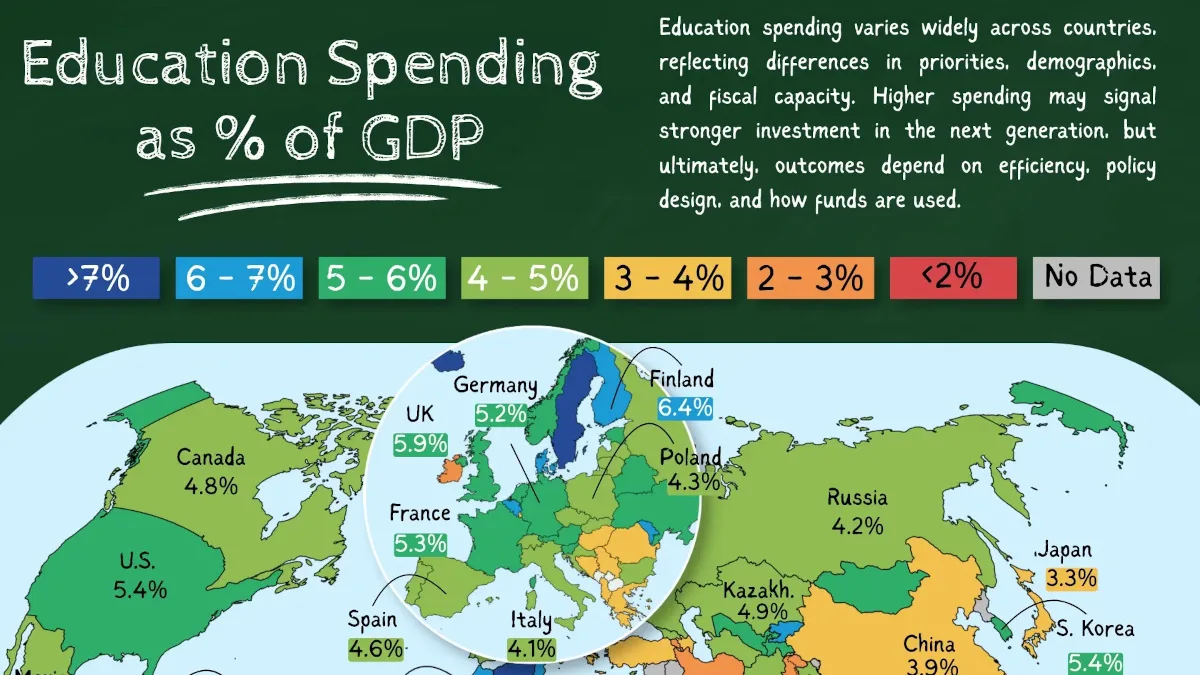
- Kiribati allocates 16.4% of GDP to education, the highest share in the world, while several countries spend less than 2%.
- Among the world’s 40 largest economies, Sweden (7.3%) devotes the largest share of GDP to education, while Indonesia (1.3%) spends the least.
- Most countries invest between 4% and 6% of GDP in education, despite wide differences in income levels.
Government spending on education offers a window into national priorities, but comparing raw budgets can be misleading.
This visualization, created by Iswardi Ishak, maps education spending as a share of GDP across 181 countries using data from the UNESCO Institute for Statistics, with additional data from Our World in Data.
Expressing spending as a share of GDP makes it easier to compare countries with vastly different economic sizes. While national wealth influences education budgets, policy choices, demographics, and fiscal capacity also shape how much governments invest in their education systems.
Education Spending as a Share of GDP, by Country
The table below shows education spending as a share of GDP across 181 countries.
| Rank | Country/Territory | Education Spending as % of GDP |
|---|---|---|
| 1 |  Kiribati Kiribati |
16.39 |
| 2 |  Tuvalu Tuvalu |
12.85 |
| 3 |  Micronesia Micronesia |
11.56 |
| 4 |  Namibia Namibia |
9.08 |
| 5 |  Algeria Algeria |
8.98 |
| 6 |  Cuba Cuba |
8.44 |
| 7 |  Solomon Islands Solomon Islands |
8.29 |
| 8 |  Botswana Botswana |
8.06 |
| 9 |  Marshall Islands Marshall Islands |
7.70 |
| 10 |  Vanuatu Vanuatu |
7.64 |
| 11 |  Mauritania Mauritania |
7.61 |
| 12 |  Bolivia Bolivia |
7.54 |
| 13 |  Sweden Sweden |
7.32 |
| 14 |  Iceland Iceland |
7.31 |
| 15 |  Kyrgyzstan Kyrgyzstan |
6.83 |
| 16 |  Tunisia Tunisia |
6.73 |
| 17 |  Lesotho Lesotho |
6.62 |
| 18 |  Moldova Moldova |
6.56 |
| 19 |  Saint Vincent and the Grenadines Saint Vincent and the Grenadines |
6.46 |
| 20 |  Kuwait Kuwait |
6.44 |
| 21 |  Finland Finland |
6.38 |
| 22 |  Denmark Denmark |
6.36 |
| 23 |  Belgium Belgium |
6.28 |
| 24 |  Senegal Senegal |
6.16 |
| 25 |  Eswatini Eswatini |
6.03 |
| 26 |  South Africa South Africa |
6.02 |
| 27 |  Morocco Morocco |
6.02 |
| 28 |  Mozambique Mozambique |
5.98 |
| 29 |  Israel Israel |
5.93 |
| 30 |  United Kingdom United Kingdom |
5.91 |
| 31 |  Bhutan Bhutan |
5.85 |
| 32 |  Nauru Nauru |
5.78 |
| 33 |  Brazil Brazil |
5.62 |
| 34 |  Jamaica Jamaica |
5.51 |
| 35 |  Uzbekistan Uzbekistan |
5.47 |
| 36 |  Samoa Samoa |
5.46 |
| 37 |  Tajikistan Tajikistan |
5.44 |
| 38 |  Palestine Palestine |
5.43 |
| 39 |  Norway Norway |
5.43 |
| 40 |  United States United States |
5.42 |
| 41 |  South Korea South Korea |
5.41 |
| 42 |  Dominica Dominica |
5.39 |
| 43 |  Burkina Faso Burkina Faso |
5.33 |
| 44 |  France France |
5.32 |
| 45 |  Costa Rica Costa Rica |
5.31 |
| 46 |  Tonga Tonga |
5.31 |
| 47 |  Slovenia Slovenia |
5.28 |
| 48 |  Austria Austria |
5.28 |
| 49 |  Colombia Colombia |
5.26 |
| 50 |  East Timor East Timor |
5.24 |
| 51 |  Germany Germany |
5.24 |
| 52 |  New Zealand New Zealand |
5.21 |
| 53 |  Mongolia Mongolia |
5.21 |
| 54 |  Estonia Estonia |
5.21 |
| 55 |  Netherlands Netherlands |
5.18 |
| 56 |  Maldives Maldives |
5.17 |
| 57 |  Ukraine Ukraine |
5.14 |
| 58 |  Grenada Grenada |
5.13 |
| 59 |  Australia Australia |
5.06 |
| 60 |  Belarus Belarus |
5.05 |
| 61 |  Sao Tome and Principe Sao Tome and Principe |
5.03 |
| 62 |  Argentina Argentina |
5.00 |
| 63 |  Chile Chile |
4.91 |
| 64 |  Kazakhstan Kazakhstan |
4.86 |
| 65 |  Switzerland Switzerland |
4.86 |
| 66 |  Canada Canada |
4.84 |
| 67 |  Uruguay Uruguay |
4.76 |
| 68 |  Cyprus Cyprus |
4.74 |
| 69 |  Malta Malta |
4.71 |
| 70 |  Slovakia Slovakia |
4.66 |
| 71 |  Belize Belize |
4.62 |
| 72 |  Rwanda Rwanda |
4.61 |
| 73 |  Spain Spain |
4.59 |
| 74 |  Portugal Portugal |
4.55 |
| 75 |  Honduras Honduras |
4.55 |
| 76 |  Burundi Burundi |
4.50 |
| 77 |  Bulgaria Bulgaria |
4.50 |
| 78 |  Saudi Arabia Saudi Arabia |
4.48 |
| 79 |  Seychelles Seychelles |
4.45 |
| 80 |  Guyana Guyana |
4.45 |
| 81 |  Brunei Brunei |
4.43 |
| 82 |  Oman Oman |
4.38 |
| 83 |  Peru Peru |
4.36 |
| 84 |  Cape Verde Cape Verde |
4.35 |
| 85 |  Afghanistan Afghanistan |
4.34 |
| 86 |  Latvia Latvia |
4.32 |
| 87 |  Poland Poland |
4.31 |
| 88 |  Czechia Czechia |
4.30 |
| 89 |  Turkmenistan Turkmenistan |
4.29 |
| 90 |  Puerto Rico Puerto Rico |
4.27 |
| 91 |  Lithuania Lithuania |
4.25 |
| 92 |  Mauritius Mauritius |
4.25 |
| 93 |  Fiji Fiji |
4.25 |
| 94 |  Mali Mali |
4.18 |
| 95 |  Russia Russia |
4.16 |
| 96 |  Togo Togo |
4.14 |
| 97 |  India India |
4.10 |
| 98 |  Croatia Croatia |
4.09 |
| 99 |  Niger Niger |
4.07 |
| 100 |  Zambia Zambia |
4.07 |
| 101 |  Italy Italy |
4.07 |
| 102 |  Mexico Mexico |
4.06 |
| 103 |  Kenya Kenya |
4.02 |
| 104 |  Georgia Georgia |
3.98 |
| 105 |  Philippines Philippines |
3.97 |
| 106 |  China China |
3.90 |
| 107 |  United Arab Emirates United Arab Emirates |
3.89 |
| 108 |  Saint Lucia Saint Lucia |
3.85 |
| 109 |  Hungary Hungary |
3.80 |
| 110 |  Dominican Republic Dominican Republic |
3.76 |
| 111 |  Djibouti Djibouti |
3.75 |
| 112 |  Luxembourg Luxembourg |
3.74 |
| 113 |  Ecuador Ecuador |
3.69 |
| 114 |  Nepal Nepal |
3.69 |
| 115 |  Azerbaijan Azerbaijan |
3.66 |
| 116 |  Cote d’Ivoire Cote d’Ivoire |
3.61 |
| 117 |  Barbados Barbados |
3.56 |
| 118 |  Paraguay Paraguay |
3.53 |
| 119 |  Malaysia Malaysia |
3.51 |
| 120 |  Saint Kitts and Nevis Saint Kitts and Nevis |
3.50 |
| 121 |  Palau Palau |
3.44 |
| 122 |  Serbia Serbia |
3.40 |
| 123 |  Greece Greece |
3.38 |
| 124 |  Congo Congo |
3.34 |
| 125 |  Japan Japan |
3.34 |
| 126 |  El Salvador El Salvador |
3.32 |
| 127 |  Romania Romania |
3.28 |
| 128 |  Bosnia and Herzegovina Bosnia and Herzegovina |
3.25 |
| 129 |  Qatar Qatar |
3.23 |
| 130 |  Trinidad and Tobago Trinidad and Tobago |
3.23 |
| 131 |  Jordan Jordan |
3.23 |
| 132 |  Benin Benin |
3.23 |
| 133 |  Chad Chad |
3.20 |
| 134 |  Tanzania Tanzania |
3.16 |
| 135 |  Antigua and Barbuda Antigua and Barbuda |
3.11 |
| 136 |  Turkey Turkey |
3.10 |
| 137 |  Albania Albania |
3.09 |
| 138 |  Guatemala Guatemala |
3.08 |
| 139 |  Madagascar Madagascar |
3.05 |
| 140 |  Ghana Ghana |
2.91 |
| 141 |  Ireland Ireland |
2.90 |
| 142 |  San Marino San Marino |
2.90 |
| 143 |  Vietnam Vietnam |
2.89 |
| 144 |  Nicaragua Nicaragua |
2.87 |
| 145 |  Suriname Suriname |
2.87 |
| 146 |  Democratic Republic of Congo Democratic Republic of Congo |
2.84 |
| 147 |  Cameroon Cameroon |
2.84 |
| 148 |  Iran Iran |
2.82 |
| 149 |  Gambia Gambia |
2.81 |
| 150 |  Malawi Malawi |
2.75 |
| 151 |  Bahamas Bahamas |
2.74 |
| 152 |  Sierra Leone Sierra Leone |
2.62 |
| 153 |  Uganda Uganda |
2.56 |
| 154 |  Thailand Thailand |
2.52 |
| 155 |  Angola Angola |
2.51 |
| 156 |  Panama Panama |
2.47 |
| 157 |  Armenia Armenia |
2.44 |
| 158 |  Comoros Comoros |
2.34 |
| 159 |  Gabon Gabon |
2.32 |
| 160 |  Ethiopia Ethiopia |
2.30 |
| 161 |  Liberia Liberia |
2.27 |
| 162 |  Singapore Singapore |
2.19 |
| 163 |  Cambodia Cambodia |
2.18 |
| 164 |  Bangladesh Bangladesh |
2.03 |
| 165 |  Myanmar Myanmar |
2.00 |
| 166 |  Pakistan Pakistan |
1.95 |
| 167 |  Andorra Andorra |
1.90 |
| 168 |  Bahrain Bahrain |
1.89 |
| 169 |  Central African Republic Central African Republic |
1.83 |
| 170 |  Sri Lanka Sri Lanka |
1.83 |
| 171 |  Monaco Monaco |
1.73 |
| 172 |  Guinea Guinea |
1.72 |
| 173 |  South Sudan South Sudan |
1.57 |
| 174 |  Indonesia Indonesia |
1.28 |
| 175 |  Laos Laos |
1.23 |
| 176 |  Lebanon Lebanon |
1.22 |
| 177 |  Haiti Haiti |
0.96 |
| 178 |  Papua New Guinea Papua New Guinea |
0.78 |
| 179 |  Zimbabwe Zimbabwe |
0.38 |
| 180 |  Nigeria Nigeria |
0.32 |
| 181 |  Somalia Somalia |
0.0000081 |
Small island nations dominate the top of the global rankings. Kiribati leads at 16.4% of GDP, followed by Tuvalu (12.9%) and Micronesia (11.6%). Namibia (9.1%) and Algeria (9.0%) also rank highly, showing that large education budgets relative to GDP are not limited to wealthy economies.
Among the world’s 40 largest economies, Sweden leads with 7.3% of GDP dedicated to education, followed by Denmark (6.4%) and Belgium (6.3%). The U.K. (5.9%), Brazil (5.6%), the U.S. (5.4%), and South Korea (5.4%) also rank among the highest-spending major economies.
Why Do Some Countries Spend More Than Others?
Education spending reflects a combination of political priorities, demographics, and fiscal capacity. According to the OECD, countries with younger populations often require larger investments to accommodate growing numbers of students, while aging societies may face less enrollment pressure. Governments must also balance education spending against competing demands such as healthcare, pensions, and infrastructure.
Spending alone, however, does not determine educational outcomes. The World Bank argues that how funds are allocated can be just as important as the size of the budget. Teacher quality, governance, and accountability can all influence whether additional spending improves learning outcomes.
Patterns Across Major Economies
Economic development alone does not explain education spending. High-income countries appear near both the top and bottom of the rankings among major economies. Sweden and Denmark devote more than 6% of GDP to education, while Singapore (2.2%), Ireland (2.9%), and Japan (3.3%) spend considerably smaller shares.
Several emerging economies also allocate larger shares than many wealthier countries. Brazil spends 5.6% of GDP on education, while South Africa spends 6.0%. This suggests that education budgets depend on national policy choices as much as economic output, much like broader differences in tax revenue as a share of GDP.
A higher share of GDP does not automatically translate into stronger educational outcomes. Results also depend on how effectively funding is used, including the quality of teaching, curriculum design, governance, and access to education. Countries with similar spending levels can therefore achieve very different outcomes.
Learn More on the Voronoi App 
For another look at how economic conditions vary around the world, see India is Projected to Have the Highest GDP Growth of Key Economies on the Voronoi app.