Mapped: Where America Produces Natural Gas
See visuals like this from many other data creators on our Voronoi app. Download it for free on iOS or Android and discover incredible data-driven charts from a variety of trusted sources.
Key Takeaways
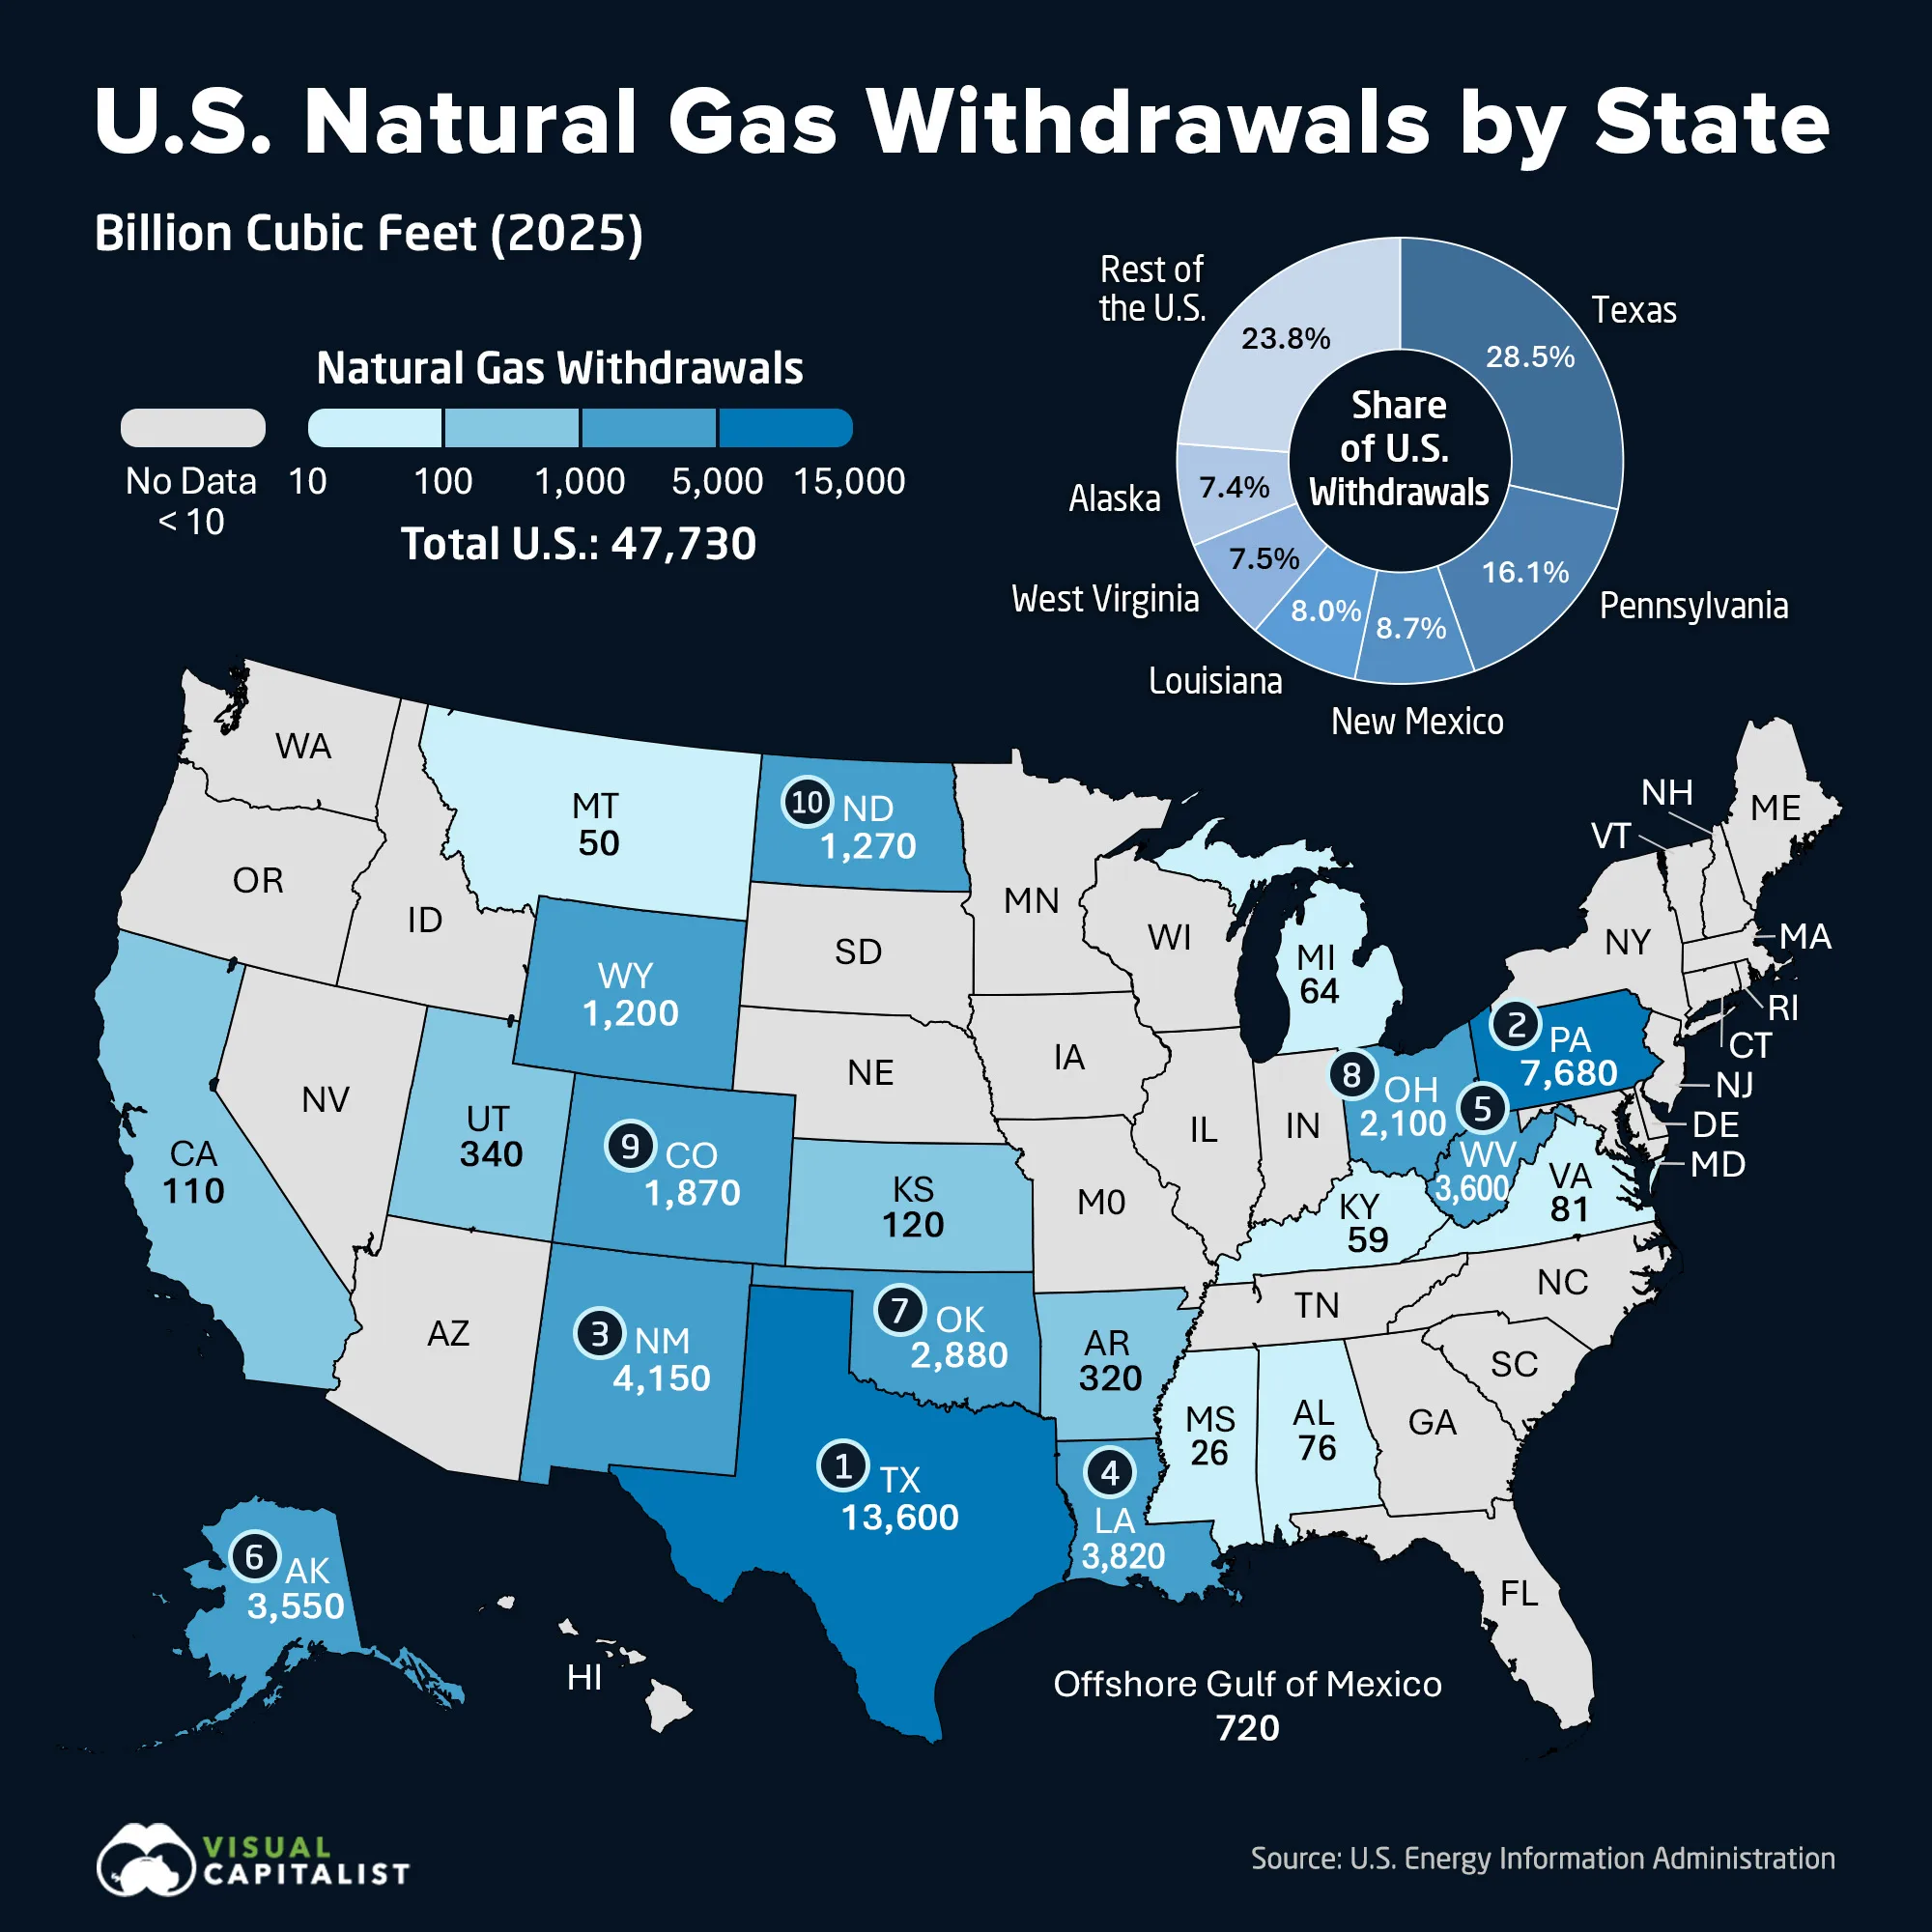
- Texas accounted for 28.5% of U.S. gross natural gas withdrawals in 2025, more than any other state.
- The four leading states, Texas, Pennsylvania, New Mexico, and Louisiana, accounted for 61.3% of U.S. withdrawals.
- Appalachia is America’s second major gas-producing region, led by Pennsylvania’s Marcellus Shale.
U.S. gross natural gas withdrawals reached 47.7 trillion cubic feet in 2025, with a small group of states accounting for most of the total. Much of this output comes from prolific shale formations such as the Permian, Marcellus, Haynesville, and Eagle Ford.
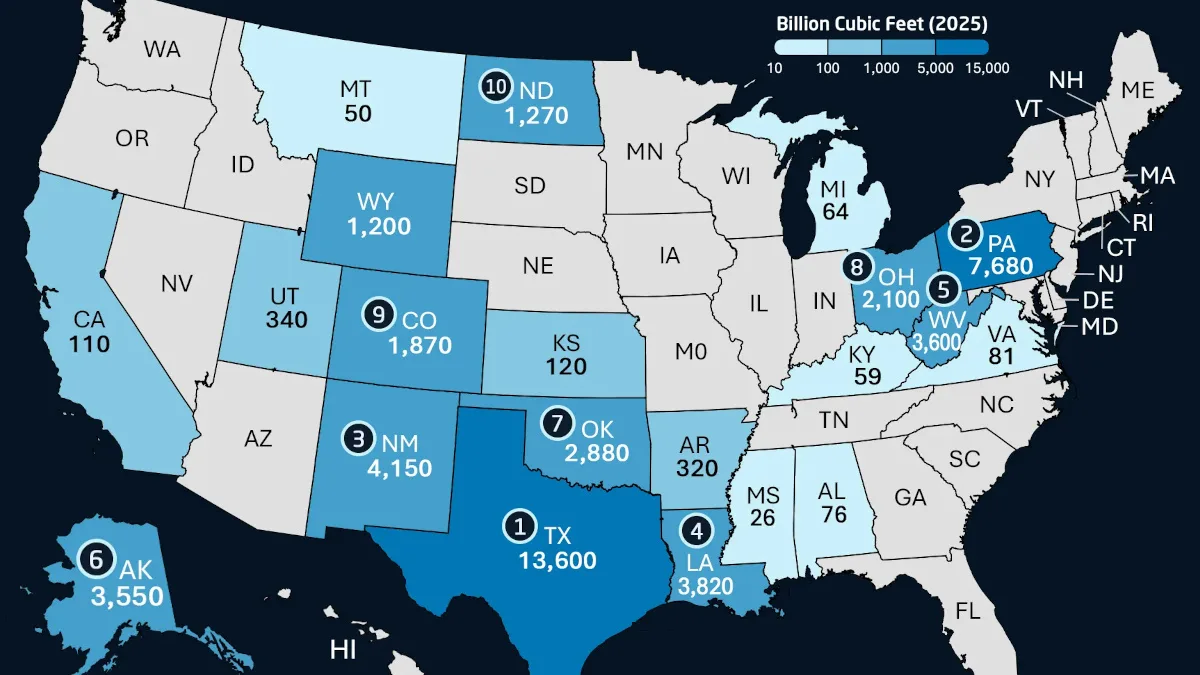
This map shows 2025 gross natural gas withdrawals by state and producing area using data from the U.S. Energy Information Administration, with the latest available 2024 figures used for five states.
Gross withdrawals measure total well-stream production before processing, making them different from marketed or dry natural gas output.
Texas Produced Over a Quarter of U.S. Natural Gas
Texas led the country with 13,603 Bcf of gross withdrawals in 2025, equal to 28.5% of the national total. Pennsylvania followed at 7,676 Bcf, or 16.1%, meaning the two states together accounted for nearly 45% of U.S. withdrawals.
Their output is driven by some of North America’s most productive shale formations, including the Permian Basin in Texas and the Marcellus Shale in Pennsylvania.
The table below ranks every state and producing area with at least 10 Bcf of gross withdrawals. States below that threshold, which together account for roughly 0.1% of the national total, are not shown:
| Rank | State or Producing Area | Gross Natural Gas Withdrawals (Billion Cubic Feet) |
Share U.S. Total (%) |
|---|---|---|---|
| 1 | Texas | 13603.5 | 28.5 |
| 2 | Pennsylvania | 7675.8 | 16.1 |
| 3 | New Mexico | 4150.5 | 8.7 |
| 4 | Louisiana | 3817.3 | 8.0 |
| 5 | West Virginia | 3600.0 | 7.5 |
| 6 | Alaska | 3546.1 | 7.4 |
| 7 | Oklahoma | 2877.7 | 6.0 |
| 8 | Ohio | 2100.7 | 4.4 |
| 9 | Colorado | 1869.8 | 3.9 |
| 10 | North Dakota | 1266.3 | 2.7 |
| 11 | Wyoming | 1197.5 | 2.5 |
| 12 | Offshore Gulf of Mexico | 721.5 | 1.5 |
| 13 | Utah | 338.7 | 0.7 |
| 14 | Arkansas | 323.3 | 0.7 |
| 15 | Kansas | 122.3 | 0.3 |
| 16 | California | 113.2 | 0.2 |
| 17 | Virginia | 80.9 | 0.2 |
| 18 | Alabama | 75.8 | 0.2 |
| 19 | Michigan | 64.1 | 0.1 |
| 20 | Kentucky | 58.8 | 0.1 |
| 21 | Montana | 50.5 | 0.1 |
| 22 | Mississippi | 25.8 | 0.1 |
New Mexico and Louisiana ranked third and fourth, producing 4,151 Bcf and 3,817 Bcf, respectively. Combined with Texas and Pennsylvania, the four states generated 61.3% of U.S. gross natural gas withdrawals in 2025.
Appalachia Forms America’s Second Major Gas Hub
Beyond Texas, the Appalachian Basin has become the country’s other major gas-producing hub.
Pennsylvania, West Virginia, and Ohio together produced 13,377 Bcf in 2025, equal to 28% of the U.S. total, largely from the Marcellus and Utica shale formations.
Alaska ranked just behind West Virginia despite having no pipeline connection to the Lower 48, underscoring the scale of its resource base.
This production base helps explain the country’s leading position in global gas markets. See how U.S. dry natural gas production ranks against other major producing countries.
Learn More on the Voronoi App 
If you enjoyed today’s post, check out Natural Gas Withdrawals Across U.S. States (2023) on Voronoi.