Ranked: The Income Needed to Be Happy in 50 U.S. Cities
Key Takeaways
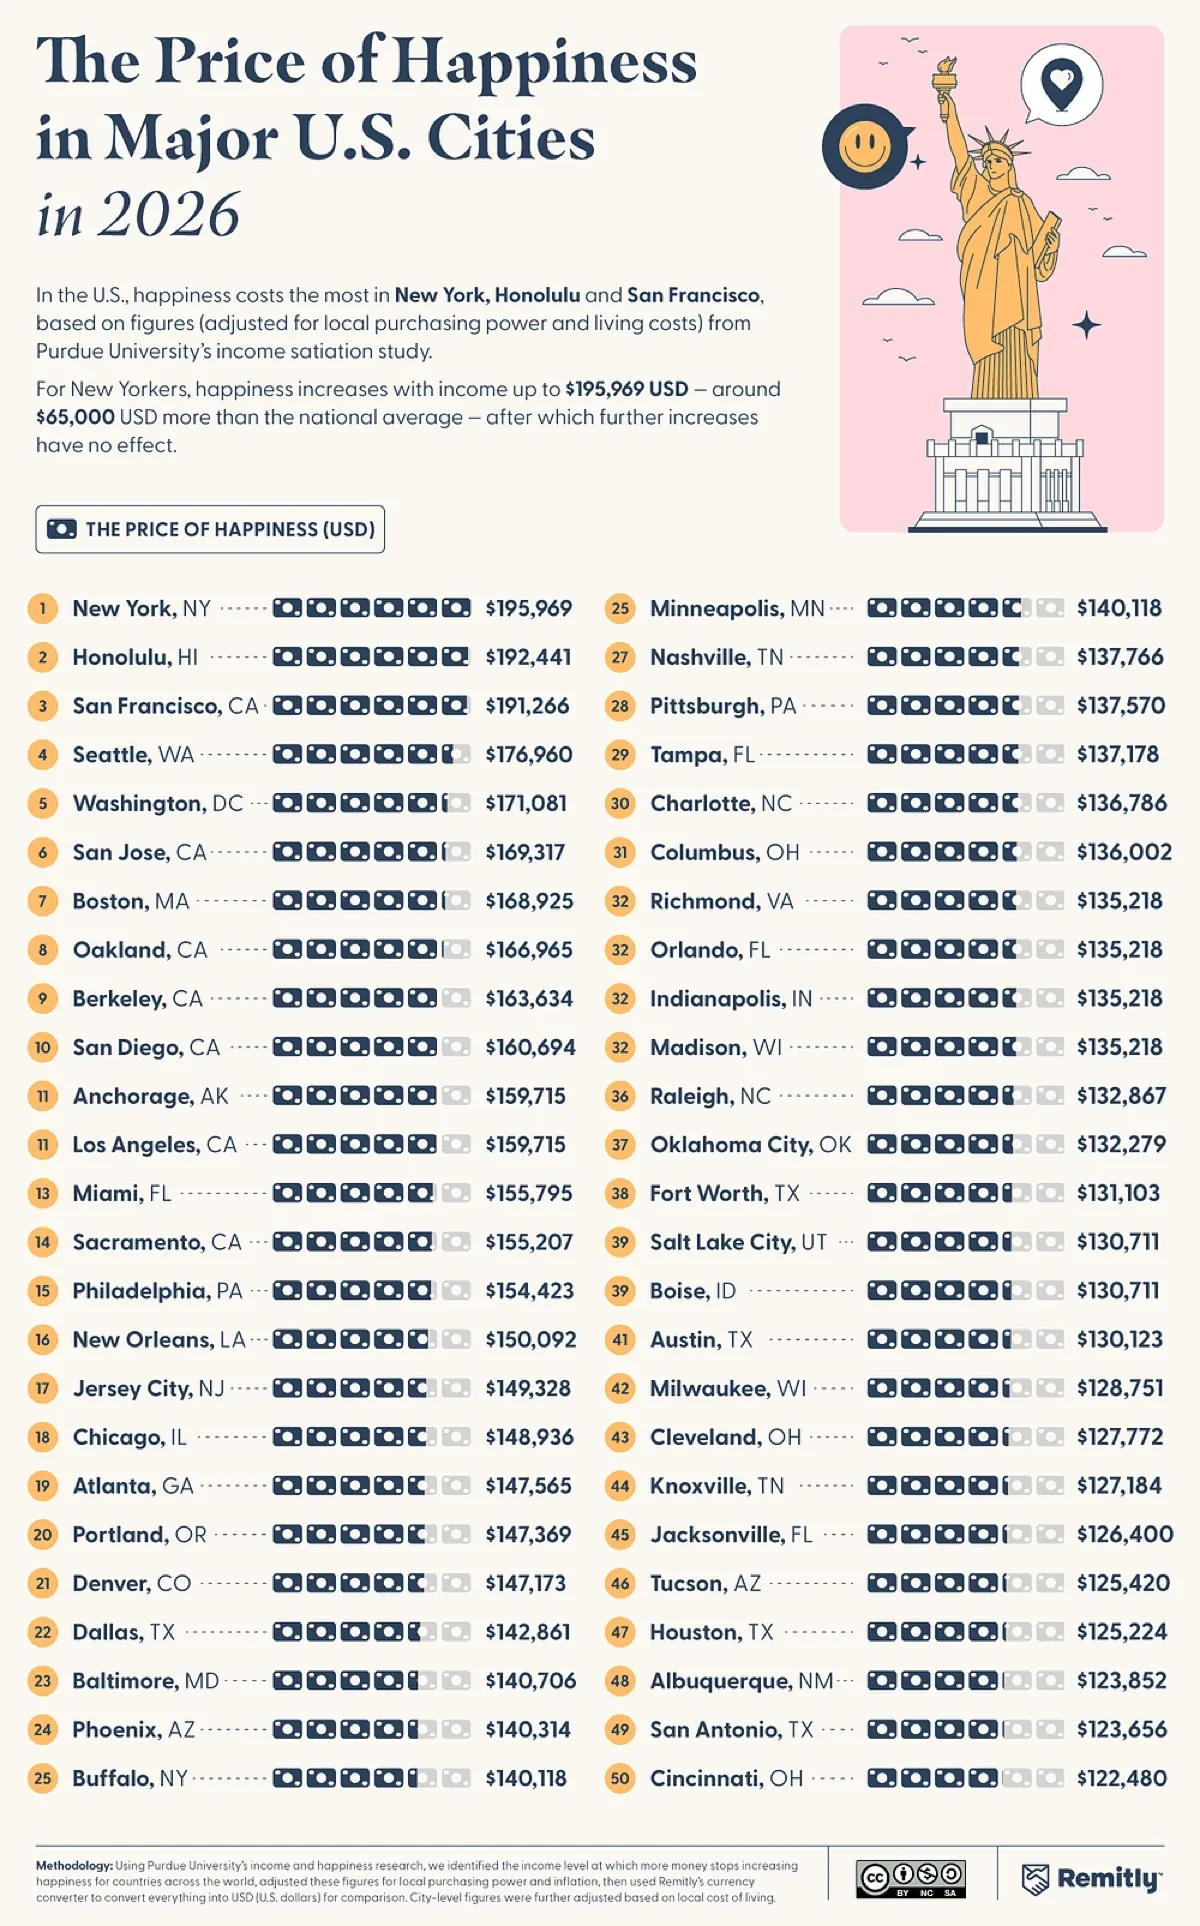
- The estimated income needed to reach peak life satisfaction ranges from $122,480 in Cincinnati to $195,969 in New York.
- California accounts for five of the 10 most expensive cities in the ranking, led by San Francisco at $191,266.
- Austin, Houston, and San Antonio all rank among the 10 cities with the lowest income thresholds.
How much money does it take before earning more no longer makes people happier? Researchers call this threshold the satiation point, and it varies considerably across the United States.
This graphic ranks 50 of the most populous U.S. cities by the annual income at which self-reported life evaluation stops improving, using data from Remitly.
Remitly adapted Purdue University‘s income satiation research by adjusting it for purchasing power and inflation, then scaling the U.S. figure to each metro using Numbeo’s cost-of-living index.
Coastal U.S. Cities Have the Highest Price of Happiness
Nationally, happiness levels off at an estimated annual income of $134,827. In New York City, the threshold rises to $195,969, or 45.3% above the national figure.
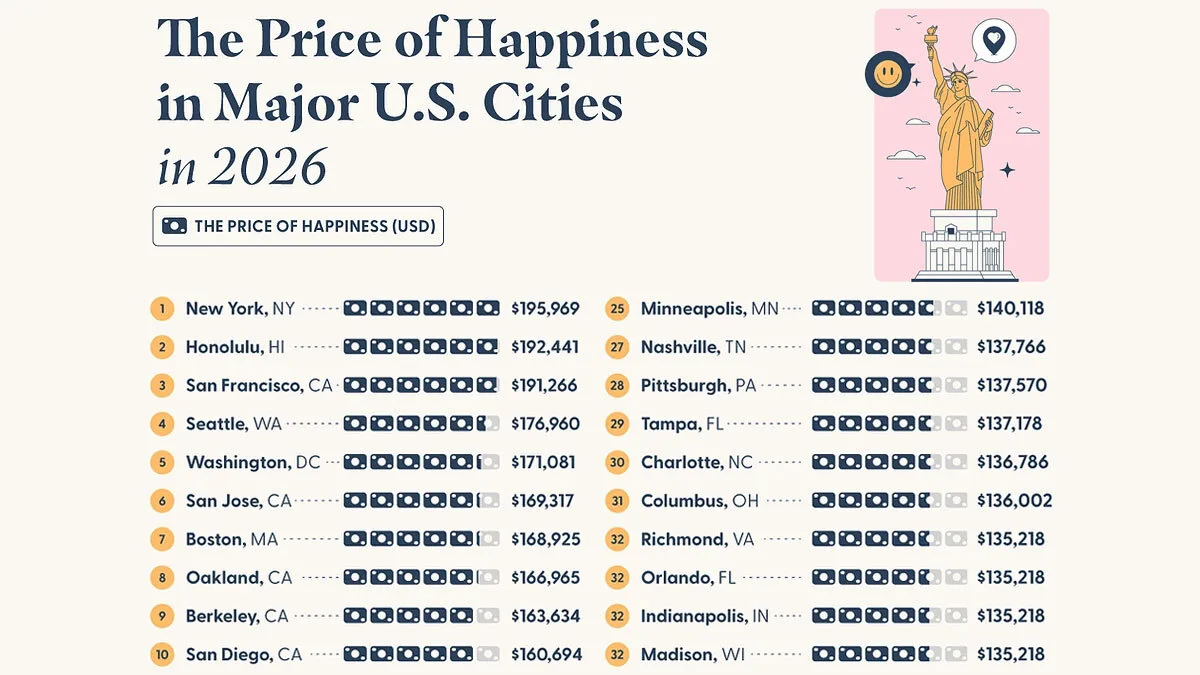
New York is followed by Honolulu ($192,441) and San Francisco ($191,266). In all three cities, the estimated income threshold exceeds $190,000 a year.
The table below shows the price of happiness in each of the 50 cities and how each compares with the $134,827 U.S. average:
| Rank | City | State | Price of Happiness | vs. U.S. Average |
|---|---|---|---|---|
| 1 | New York | NY | $195,969 | +45.3% |
| 2 | Honolulu | HI | $192,441 | +42.7% |
| 3 | San Francisco | CA | $191,266 | +41.9% |
| 4 | Seattle | WA | $176,960 | +31.2% |
| 5 | Washington | DC | $171,081 | +26.9% |
| 6 | San Jose | CA | $169,317 | +25.6% |
| 7 | Boston | MA | $168,925 | +25.3% |
| 8 | Oakland | CA | $166,965 | +23.8% |
| 9 | Berkeley | CA | $163,634 | +21.4% |
| 10 | San Diego | CA | $160,694 | +19.2% |
| 11 | Anchorage | AK | $159,715 | +18.5% |
| 11 | Los Angeles | CA | $159,715 | +18.5% |
| 13 | Miami | FL | $155,795 | +15.6% |
| 14 | Sacramento | CA | $155,207 | +15.1% |
| 15 | Philadelphia | PA | $154,423 | +14.5% |
| 16 | New Orleans | LA | $150,092 | +11.3% |
| 17 | Jersey City | NJ | $149,328 | +10.8% |
| 18 | Chicago | IL | $148,936 | +10.5% |
| 19 | Atlanta | GA | $147,565 | +9.4% |
| 20 | Portland | OR | $147,369 | +9.3% |
| 21 | Denver | CO | $147,173 | +9.2% |
| 22 | Dallas | TX | $142,861 | +6.0% |
| 23 | Baltimore | MD | $140,706 | +4.4% |
| 24 | Phoenix | AZ | $140,314 | +4.1% |
| 25 | Buffalo | NY | $140,118 | +3.9% |
| 25 | Minneapolis | MN | $140,118 | +3.9% |
| 27 | Nashville | TN | $137,766 | +2.2% |
| 28 | Pittsburgh | PA | $137,570 | +2.0% |
| 29 | Tampa | FL | $137,178 | +1.7% |
| 30 | Charlotte | NC | $136,786 | +1.5% |
| 31 | Columbus | OH | $136,002 | +0.9% |
| 32 | Richmond | VA | $135,218 | +0.3% |
| 32 | Orlando | FL | $135,218 | +0.3% |
| 32 | Indianapolis | IN | $135,218 | +0.3% |
| 32 | Madison | WI | $135,218 | +0.3% |
| 36 | Raleigh | NC | $132,867 | -1.5% |
| 37 | Oklahoma City | OK | $132,279 | -1.9% |
| 38 | Fort Worth | TX | $131,103 | -2.8% |
| 39 | Salt Lake City | UT | $130,711 | -3.1% |
| 39 | Boise | ID | $130,711 | -3.1% |
| 41 | Austin | TX | $130,123 | -3.5% |
| 42 | Milwaukee | WI | $128,751 | -4.5% |
| 43 | Cleveland | OH | $127,772 | -5.2% |
| 44 | Knoxville | TN | $127,184 | -5.7% |
| 45 | Jacksonville | FL | $126,400 | -6.3% |
| 46 | Tucson | AZ | $125,420 | -7.0% |
| 47 | Houston | TX | $125,224 | -7.1% |
| 48 | Albuquerque | NM | $123,852 | -8.1% |
| 49 | San Antonio | TX | $123,656 | -8.3% |
| 50 | Cincinnati | OH | $122,480 | -9.2% |
The upper end of the ranking is dominated by coastal cities. California alone claims five of the top 10 spots: San Francisco, San Jose, Oakland, Berkeley, and San Diego. Seattle ($176,960), Washington, D.C. ($171,081), and Boston ($168,925) also rank among the most expensive cities.
Overall, 35 of the 50 cities have income thresholds above the national figure, partly reflecting the higher living costs found in many of America’s largest metropolitan areas.
Where Happiness Costs the Least in America
Cincinnati has the lowest estimated price of happiness in the ranking at $122,480, or 37.5% less than New York. Put another way, reaching income satiation in New York requires about 1.6 times as much income as it does in Cincinnati.
Texas is the most heavily represented state near the affordable end of the ranking. Austin ($130,123), Houston ($125,224), and San Antonio ($123,656) all place in the bottom 10, alongside Albuquerque, Tucson, and Jacksonville. Dallas is the only Texas city in the upper half, ranking 22nd.
The pattern closely tracks broader cost-of-living differences between U.S. metros, which also shape the income needed to live comfortably in U.S. cities. Where housing and everyday expenses are lower, the estimated income required to reach the plateau falls as well.
Learn More on the Voronoi App 
If you enjoyed today’s post, check out Money Can Buy Happiness After All on Voronoi.