Ranked: America’s Fastest-Aging States
Key Takeaways
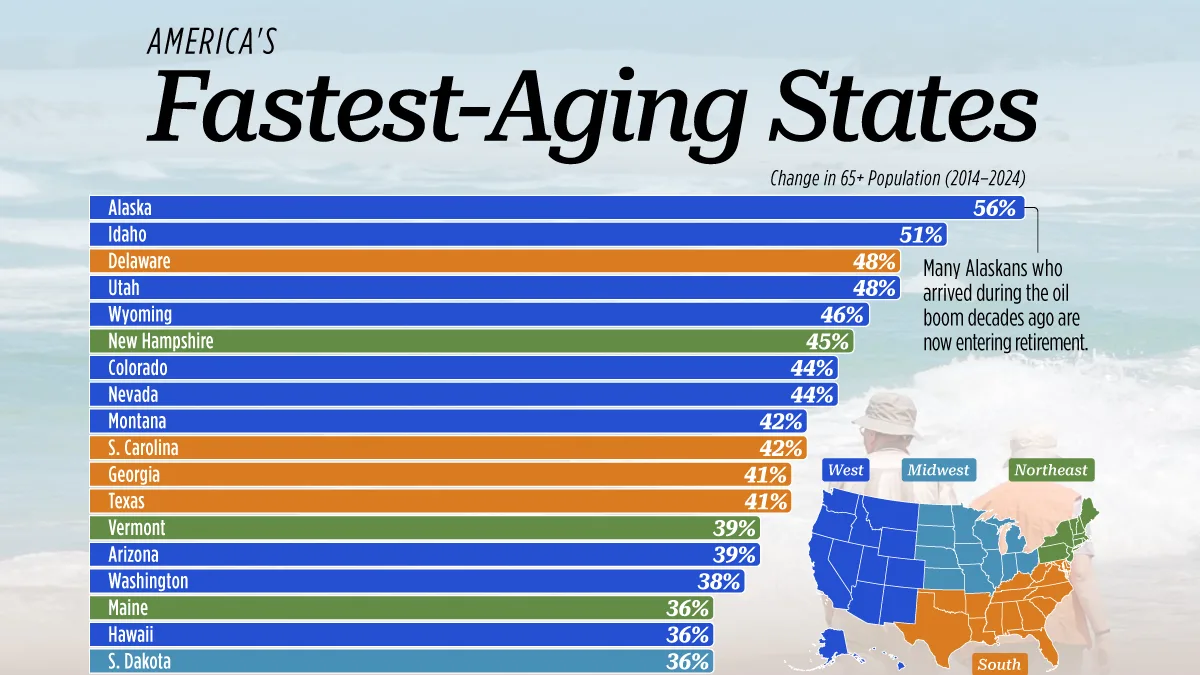
- Alaska’s population aged 65 and older grew 56% between 2014 and 2024, the fastest increase of any state.
- Idaho, Delaware, and Utah also recorded increases of nearly 50% over the decade.
- West Virginia posted the slowest growth, partly because it already had one of America’s oldest populations in 2014.
America’s population is getting older, but some states are aging much faster than others.
Using U.S. Census Bureau data compiled by USAFacts, this ranking shows how much each state’s population aged 65 and older grew between 2014 and 2024.
Growth in 65-and-Older Populations (2014-2024)
The table below ranks every state by the percentage growth in its population aged 65 and older between 2014 and 2024.
| State | Change in 65+ Population (2014–2024) | Total Growth |
|---|---|---|
| Alaska | 56% | 39,425 |
| Idaho | 51% | 120,188 |
| Delaware | 48% | 74,383 |
| Utah | 48% | 140,632 |
| Wyoming | 46% | 36,760 |
| New Hampshire | 45% | 93,596 |
| Colorado | 44% | 300,169 |
| Nevada | 44% | 175,038 |
| Montana | 42% | 71,509 |
| South Carolina | 42% | 319,192 |
| Georgia | 41% | 513,532 |
| Texas | 41% | 1,265,419 |
| Vermont | 39% | 41,969 |
| Arizona | 39% | 420,852 |
| Washington | 38% | 382,832 |
| Maine | 36% | 87,850 |
| Hawaii | 36% | 82,756 |
| South Dakota | 36% | 46,219 |
| North Carolina | 36% | 518,927 |
| Minnesota | 35% | 275,897 |
| Virginia | 35% | 401,357 |
| New Mexico | 35% | 110,140 |
| Florida | 34% | 1,294,733 |
| Oregon | 34% | 214,979 |
| Wisconsin | 34% | 295,892 |
| North Dakota | 34% | 35,289 |
| Maryland | 33% | 275,008 |
| Rhode Island | 32% | 53,451 |
| Massachusetts | 31% | 317,385 |
| California | 30% | 1,519,339 |
| Michigan | 30% | 461,738 |
| New Jersey | 30% | 392,753 |
| Louisiana | 30% | 187,508 |
| New York | 29% | 854,478 |
| Indiana | 29% | 275,051 |
| Tennessee | 29% | 285,027 |
| Connecticut | 29% | 159,449 |
| Nebraska | 28% | 77,116 |
| Alabama | 28% | 208,362 |
| Kansas | 28% | 115,595 |
| Illinois | 27% | 484,181 |
| Kentucky | 26% | 172,658 |
| Ohio | 26% | 474,302 |
| Missouri | 25% | 235,408 |
| Pennsylvania | 25% | 530,510 |
| Iowa | 25% | 121,677 |
| Mississippi | 24% | 103,194 |
| Oklahoma | 23% | 129,764 |
| District of Columbia | 22% | 16,219 |
| Arkansas | 21% | 96,987 |
| West Virginia | 17% | 57,493 |
 U.S. total U.S. total |
34% | 14,964,188 |
Every state added residents aged 65 and older over the decade, but the increase ranged from 17% in West Virginia to 56% in Alaska. Nationwide, the senior population grew 34%.
Many of the fastest-growing senior populations were in the West and Sun Belt, including Idaho (+51%), Utah (+48%), and Texas (+41%). Several of these states began the period with relatively young populations and had experienced rapid population growth through domestic migration. As those residents aged, the number of people 65 and older rose quickly.
Why Alaska Leads
Alaska recorded the nation’s fastest-growing senior population despite not being a traditional retirement destination.
Much of the increase reflects longtime residents aging in place. Many people who moved to Alaska during the oil boom of the 1970s and 1980s are now entering retirement, helping drive the rapid increase in residents aged 65 and older.
Why Growth Was Slower Elsewhere
West Virginia, Arkansas, and the District of Columbia recorded the slowest growth in their senior populations.
A slower growth rate does not necessarily indicate a younger population. States such as West Virginia already had among the nation’s oldest populations in 2014, leaving less room for large percentage gains over the following decade.
Learn More on the Voronoi App 
To learn more about this topic, check out this graphic on the best countries to retire in.