Ranked: The Countries With the Most Freshwater
Key Takeaways
- Brazil has the world’s largest share of renewable internal freshwater resources, accounting for 13.2% of the global total.
- The top five countries account for 43.2% of the world’s renewable internal freshwater resources.
- Latin America and the Caribbean hold nearly one-third of global renewable internal freshwater resources, the largest share of any region.
Freshwater resources are concentrated among a relatively small number of countries, led by Brazil and Russia.
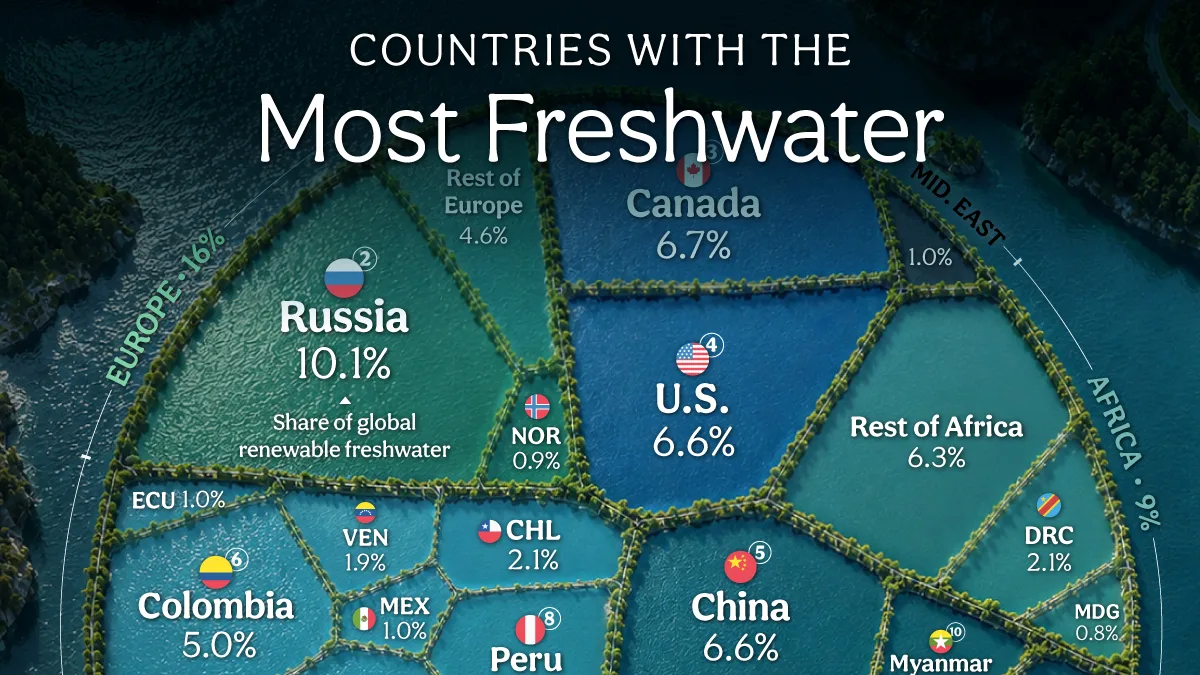
This visualization ranks countries by renewable internal freshwater resources, which measures freshwater generated within a country through river flows and groundwater recharge.
The data for this visualization comes from FAO Aquastat via the World Bank, with figures for 2022, the latest available as of August 2026.
Brazil is the World’s Freshwater Leader
Brazil ranks first globally, with 5,661 billion cubic meters of renewable internal freshwater resources, equivalent to 13.2% of the global total.
A major reason for Brazil’s freshwater abundance is the Amazon River system. The world’s largest river by average discharge rate accounts for about 75% of Brazil’s freshwater supply.
| Rank | Country | Renewable Internal Freshwater Resources (Billion Cubic Meters) |
Share of Global Renewable Freshwater Resources (%) |
|---|---|---|---|
| 1 |  Brazil Brazil |
5,661 | 13.2 |
| 2 |  Russia Russia |
4,312 | 10.1 |
| 3 |  Canada Canada |
2,850 | 6.7 |
| 4 |  United States United States |
2,818 | 6.6 |
| 5 |  China China |
2,813 | 6.6 |
| 6 |  Colombia Colombia |
2,145 | 5.0 |
| 7 |  Indonesia Indonesia |
2,019 | 4.7 |
| 8 |  Peru Peru |
1,641 | 3.8 |
| 9 |  India India |
1,446 | 3.4 |
| 10 |  Myanmar Myanmar |
1,003 | 2.3 |
| 11 |  DR Congo DR Congo |
900 | 2.1 |
| 12 |  Chile Chile |
885 | 2.1 |
| 13 |  Venezuela Venezuela |
805 | 1.9 |
| 14 |  Papua New Guinea Papua New Guinea |
801 | 1.9 |
| 15 |  Malaysia Malaysia |
580 | 1.4 |
| 16 |  Australia Australia |
492 | 1.1 |
| 17 |  Philippines Philippines |
479 | 1.1 |
| 18 |  Ecuador Ecuador |
442 | 1.0 |
| 19 |  Japan Japan |
430 | 1.0 |
| 20 |  Mexico Mexico |
409 | 1.0 |
| 21 |  Norway Norway |
382 | 0.9 |
| 22 |  Vietnam Vietnam |
359 | 0.8 |
| 23 |  Madagascar Madagascar |
337 | 0.8 |
| 24 |  New Zealand New Zealand |
327 | 0.8 |
| 25 |  Bolivia Bolivia |
303.5 | 0.7 |
| — |  World World |
42,807 | 100 |
Despite having the largest freshwater resources overall, Brazilian cities regularly experience serious supply problems due to factors including declining rainfall, inadequate sanitation and wastewater treatment, and their distance from the Amazon River.
Russia ranks second, with 4,312 billion cubic meters of renewable internal freshwater resources. Like Brazil, however, much of Russia’s population and industry is located far from the areas containing its greatest freshwater resources.
The Top Five Countries Hold Over 40% of the World’s Freshwater
Brazil, Russia, Canada, the United States, and China together account for 43.2% of global renewable internal freshwater resources.
Canada ranks third with 2,850 billion cubic meters, or 6.7% of the global total. The United States and China follow closely, each holding 6.6%.
When measured by renewable freshwater available per person, the country ranking looks very different.
By that measure, Brazil ranks 24th globally, with 26,918 cubic meters of freshwater resources per person, while Russia ranks 21st with 29,895 cubic meters per person.
Canada’s lower population helps it rank sixth globally on a per-capita basis, much closer to its third-place position by total freshwater resources.
Latin America Has the Largest Regional Share
At the regional level, Latin America and the Caribbean account for nearly one-third of global renewable internal freshwater resources.
Asia-Pacific follows with 29%, while Europe holds 16%. North America accounts for 13%, driven by Canada and the United States.
Africa accounts for 9% of the global total, while the Middle East holds just 1%. Water scarcity is particularly acute across both regions: seven of the 20 countries with the least freshwater per person are in the Middle East, and another seven are in Africa.
National and regional totals, however, tell only part of the story. Population size, geography, infrastructure, and accessibility all influence how much freshwater is actually available where people need it.
Learn More on the Voronoi App
If you enjoyed this post, check out Mapped: Water Violations by State on Voronoi.