Why Europe’s CO₂ Emissions Plunge Every Summer
Key Takeaways:
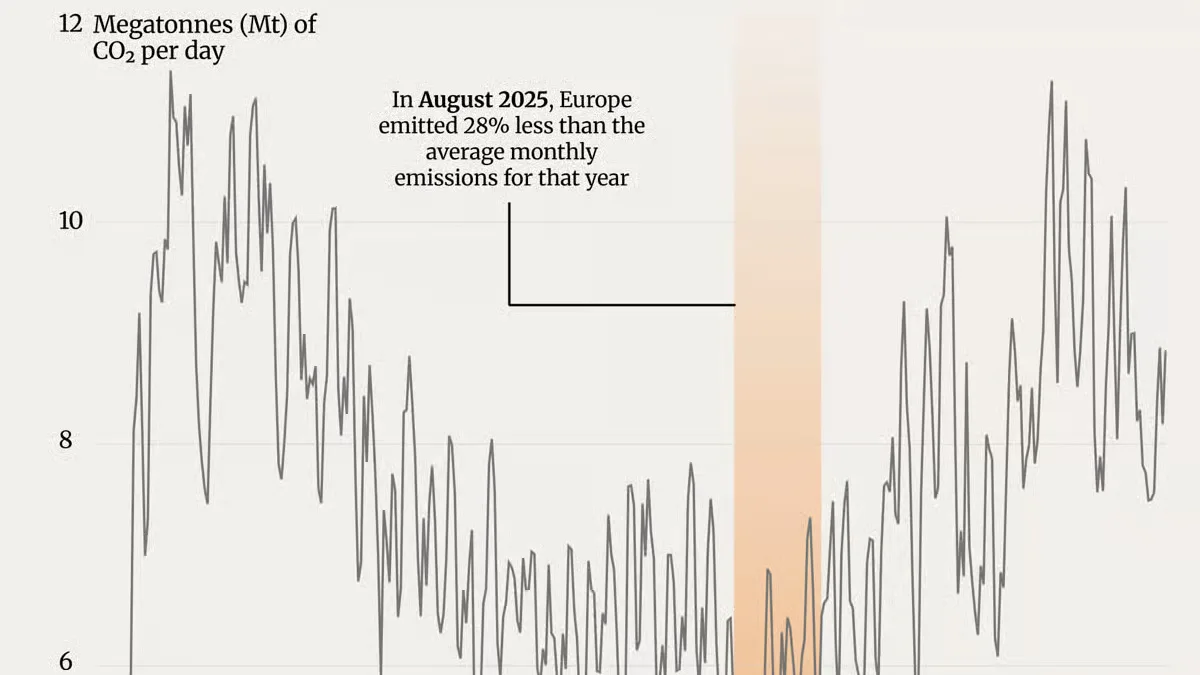
- Europe’s estimated CO₂ emissions fell to 5.6 megatonnes (Mt) per day in August 2025, the lowest monthly average of the year.
- August emissions were 28% below the 2025 monthly average, reflecting both warmer weather and Europe’s summer slowdown.
Europe’s summer holiday season doesn’t just empty offices and cities. It also leaves a visible mark on the continent’s carbon emissions.
This graphic from The European Correspondent uses data from the Copernicus European Carbon Monitor to show how daily emissions fluctuated throughout 2025.
Why Europe’s Emissions Bottom Out in Summer
The table below shows approximate monthly CO₂ emissions based on The European Correspondent’s analysis.
| Month | CO₂ emissions (Mt/day) |
|---|---|
| January | 8.6 |
| February | 9.7 |
| March | 8.2 |
| April | 7.1 |
| May | 6.6 |
| June | 6.4 |
| July | 6.5 |
| August | 5.6 |
| September | 6.5 |
| October | 7.7 |
| November | 7.9 |
| December | 9.1 |
The seasonal swing is substantial: August emissions were roughly 42% below February’s peak of 9.7 Mt per day before beginning to climb again in autumn.
Several factors help explain the summer dip. Warmer weather reduces demand for heating, while Europe’s summer holidays slow industrial activity and electricity use. These effects help push emissions lower, although rising demand for air conditioning during heatwaves can offset some of the decline.
These seasonal swings sit within a much larger picture of changing carbon emissions by region and the long-term transition away from fossil fuels.
The Other Side of Europe’s Hot Summers
Lower fossil-fuel emissions in August don’t necessarily signal milder climate conditions. Hotter, drier summers can intensify drought and wildfire risk while increasing demand for air conditioning and putting additional strain on electricity systems.
Copernicus found that Europe’s extreme summer conditions in 2022 helped push EU wildfire carbon emissions to their highest level since 2007. More recently, severe heat and drought have continued to challenge European power systems and fuel major wildfires.
For individuals, seasonal changes in heating, transport, and travel can also substantially alter the carbon footprint of daily activities. Europe’s August dip illustrates how closely emissions remain tied to human activity—and to the weather.
Learn More on the Voronoi App
To explore another dimension of the carbon cycle, see Visualized: Which Countries Capture the Most Carbon? on the Voronoi app.