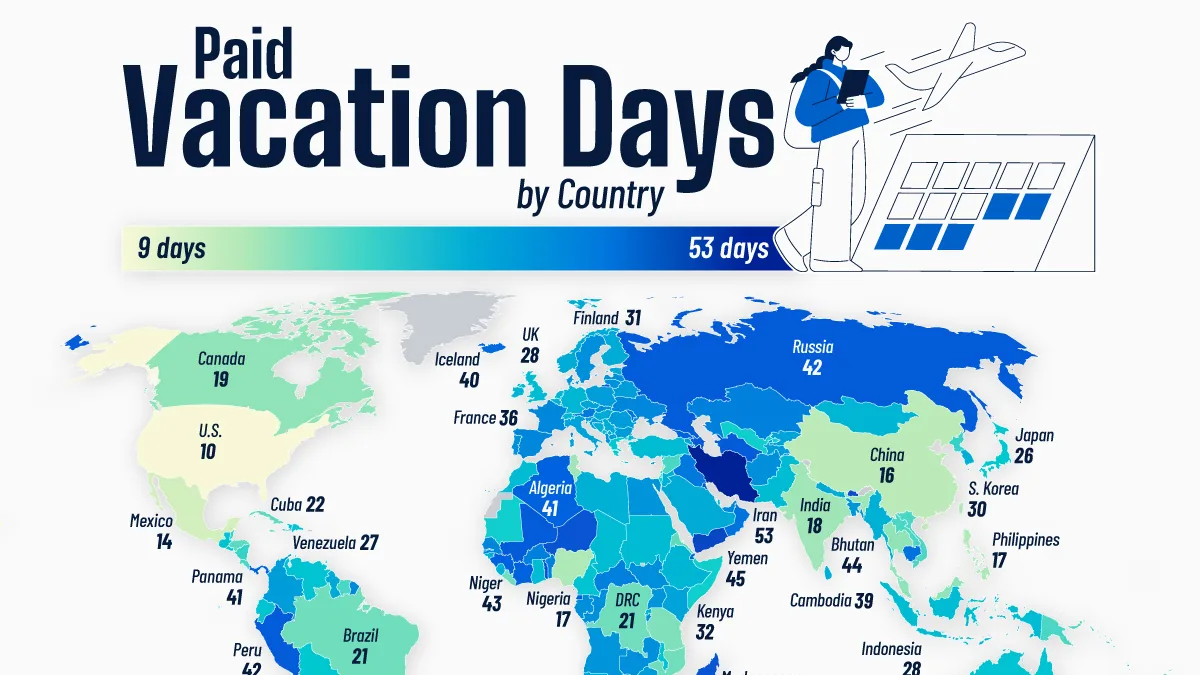
Mapped: Paid Vacation Days Around the World
Key Takeaways
- Iran leads with 53 paid vacation days and public holidays, more than five times the U.S. total of 10.
- The U.S. ranks second-to-last among 185 countries, ahead of only Micronesia.
- European countries tend to cluster around or above the global average, while several major Asian economies fall below it.
Depending on where you live, legally mandated paid time off ranges from nine days to 53 days a year.
This visualization compares legally mandated annual leave and paid public holidays across 185 countries in 2025, based on data compiled by Resume.io.
Across the dataset, the global average is 30 days.
Ranked: Paid Vacation Days by Country
This table ranks 185 countries by their combined paid vacation days and public holidays.
| Country | Total Paid Vacation Days (2025) |
|---|---|
 Iran Iran |
53 |
 Yemen Yemen |
45 |
 Bahrain Bahrain |
44 |
 Bhutan Bhutan |
44 |
 Madagascar Madagascar |
43 |
 Niger Niger |
43 |
 Togo Togo |
43 |
 Azerbaijan Azerbaijan |
42 |
 Kuwait Kuwait |
42 |
 Mali Mali |
42 |
 Peru Peru |
42 |
 Russia Russia |
42 |
 Turkmenistan Turkmenistan |
42 |
 Algeria Algeria |
41 |
 Cote d’Ivoire Cote d’Ivoire |
41 |
 Equatorial Guinea Equatorial Guinea |
41 |
 Georgia Georgia |
41 |
 Guinea Guinea |
41 |
 Maldives Maldives |
41 |
 Panama Panama |
41 |
 Djibouti Djibouti |
40 |
 Iceland Iceland |
40 |
 Cambodia Cambodia |
39 |
 Comoros Comoros |
39 |
 Moldova Moldova |
39 |
 Oman Oman |
39 |
 Austria Austria |
38 |
 Iraq Iraq |
38 |
 Benin Benin |
37 |
 Burkina Faso Burkina Faso |
37 |
 Central African Republic Central African Republic |
37 |
 Kazakhstan Kazakhstan |
37 |
 France France |
36 |
 Senegal Senegal |
36 |
 Spain Spain |
36 |
 Ukraine Ukraine |
36 |
 UAE UAE |
36 |
 Afghanistan Afghanistan |
35 |
 Burundi Burundi |
35 |
 Republic of the Congo Republic of the Congo |
35 |
 Gabon Gabon |
35 |
 Latvia Latvia |
35 |
 Lithuania Lithuania |
35 |
 Luxembourg Luxembourg |
35 |
 Portugal Portugal |
35 |
 Slovakia Slovakia |
35 |
 South Sudan South Sudan |
35 |
 Sweden Sweden |
35 |
 Zambia Zambia |
35 |
 Albania Albania |
34 |
 Angola Angola |
34 |
 Bangladesh Bangladesh |
34 |
 Cyprus Cyprus |
34 |
 Denmark Denmark |
34 |
 Egypt Egypt |
34 |
 Mauritius Mauritius |
34 |
 Sao Tome and Principe Sao Tome and Principe |
34 |
 South Africa South Africa |
34 |
 The Gambia The Gambia |
34 |
 Uganda Uganda |
34 |
 Belarus Belarus |
33 |
 Bulgaria Bulgaria |
33 |
 Colombia Colombia |
33 |
 Croatia Croatia |
33 |
 Poland Poland |
33 |
 Romania Romania |
33 |
 Seychelles Seychelles |
33 |
 Slovenia Slovenia |
33 |
 Tajikistan Tajikistan |
33 |
 Zimbabwe Zimbabwe |
33 |
 Armenia Armenia |
32 |
 Cape Verde Cape Verde |
32 |
 Czech Republic Czech Republic |
32 |
 Italy Italy |
32 |
 Kenya Kenya |
32 |
 Kyrgyzstan Kyrgyzstan |
32 |
 North Macedonia North Macedonia |
32 |
 Namibia Namibia |
32 |
 Uruguay Uruguay |
32 |
 Estonia Estonia |
31 |
 Finland Finland |
31 |
 Guyana Guyana |
31 |
 Hungary Hungary |
31 |
 Kosovo Kosovo |
31 |
 Nepal Nepal |
31 |
 New Zealand New Zealand |
31 |
 Norway Norway |
31 |
 Saudi Arabia Saudi Arabia |
31 |
 Serbia Serbia |
31 |
 Tonga Tonga |
31 |
 Argentina Argentina |
30 |
 Belgium Belgium |
30 |
 Bosnia and Herzegovina Bosnia and Herzegovina |
30 |
 Guinea-Bissau Guinea-Bissau |
30 |
 Jordan Jordan |
30 |
 Libya Libya |
30 |
 Myanmar Myanmar |
30 |
 Sierra Leone Sierra Leone |
30 |
 South Korea South Korea |
30 |
 Sri Lanka Sri Lanka |
30 |
 Ethiopia Ethiopia |
29 |
 Germany Germany |
29 |
 Ireland Ireland |
29 |
 Mongolia Mongolia |
29 |
 Netherlands Netherlands |
29 |
 Rwanda Rwanda |
29 |
 Switzerland Switzerland |
29 |
 Timor-Leste Timor-Leste |
29 |
 Barbados Barbados |
28 |
 Chad Chad |
28 |
 Ghana Ghana |
28 |
 Haiti Haiti |
28 |
 Indonesia Indonesia |
28 |
 Montenegro Montenegro |
28 |
 Morocco Morocco |
28 |
 Pakistan Pakistan |
28 |
 Qatar Qatar |
28 |
 Sudan Sudan |
28 |
 Turkey Turkey |
28 |
 United Kingdom United Kingdom |
28 |
 Australia Australia |
27 |
 Cameroon Cameroon |
27 |
 Dominican Republic Dominican Republic |
27 |
 Ecuador Ecuador |
27 |
 Guatemala Guatemala |
27 |
 Malawi Malawi |
27 |
 Venezuela Venezuela |
27 |
 Bolivia Bolivia |
26 |
 El Salvador El Salvador |
26 |
 Greece Greece |
26 |
 Japan Japan |
26 |
 Trinidad and Tobago Trinidad and Tobago |
26 |
 Vanuatu Vanuatu |
26 |
 Israel Israel |
25 |
 Mauritania Mauritania |
25 |
 Saint Lucia Saint Lucia |
25 |
 Saint Vincent and the Grenadines Saint Vincent and the Grenadines |
25 |
 Somalia Somalia |
25 |
 Uzbekistan Uzbekistan |
25 |
 Belize Belize |
24 |
 Nicaragua Nicaragua |
24 |
 North Korea North Korea |
24 |
 Paraguay Paraguay |
24 |
 Solomon Islands Solomon Islands |
24 |
 Eswatini Eswatini |
24 |
 Botswana Botswana |
23 |
 Costa Rica Costa Rica |
23 |
 Laos Laos |
23 |
 Papua New Guinea Papua New Guinea |
23 |
 Suriname Suriname |
23 |
 Syria Syria |
23 |
 Vietnam Vietnam |
23 |
 Cuba Cuba |
22 |
 Eritrea Eritrea |
22 |
 Grenada Grenada |
22 |
 Honduras Honduras |
22 |
 Lesotho Lesotho |
22 |
 Palestine Palestine |
22 |
 Brazil Brazil |
21 |
 DR Congo DR Congo |
21 |
 Jamaica Jamaica |
21 |
 Liberia Liberia |
21 |
 Mozambique Mozambique |
21 |
 Bahamas Bahamas |
20 |
 Chile Chile |
20 |
 Fiji Fiji |
20 |
 Samoa Samoa |
20 |
 Tanzania Tanzania |
20 |
 Canada Canada |
19 |
 Malaysia Malaysia |
19 |
 Thailand Thailand |
19 |
 Brunei Brunei |
18 |
 India India |
18 |
 Singapore Singapore |
18 |
 Tunisia Tunisia |
18 |
 Lebanon Lebanon |
17 |
 Nigeria Nigeria |
17 |
 Philippines Philippines |
17 |
 Taiwan Taiwan |
17 |
 China China |
16 |
 Mexico Mexico |
14 |
 Kiribati Kiribati |
13 |
 U.S. U.S. |
10 |
 Micronesia Micronesia |
9 |
 World Average World Average |
30 |
Why the U.S. Is Different
At 10 days, the U.S. total is just one-third of the 30-day global average in this dataset.
However, the ranking measures legally mandated time off, not all paid vacation that workers actually receive. U.S. federal law does not require private employers to provide paid vacation, leaving these benefits largely up to employers.
In practice, 80% of private-sector workers had access to paid vacation in 2025. Among workers with one year at their job, 31% received between 10 and 14 vacation days.
The Middle East Ranks High for Paid Time Off
Iran leads the ranking with 53 days of paid leave and public holidays, with its large number of public holidays partly making up for the fewer weekend days associated with its traditional six-day workweek.
The Middle East is heavily represented near the top of the ranking. Yemen has 45 days, Bahrain 44, Kuwait 42, and Oman 39. Because these totals combine statutory annual leave with paid public holidays, countries can reach similar totals through different combinations of the two.
Europe Stands Out for Paid Leave
Europe stands out less for having the highest totals and more for having relatively few countries near the bottom of the ranking.
Most European countries cluster around or above the 30-day global average. Iceland reaches 40 days, while Sweden, Portugal, and Slovakia each have 35.
Several major Asian economies rank much lower. China provides 16 days and India 18, while Japan’s 26 days also falls below the global average.
Learn More on the Voronoi App
To learn more about this topic, check out this graphic on the countries gaining and losing the most tourists.