Mapped: U.S. Population Growth and Decline by 2040
Key Takeaways
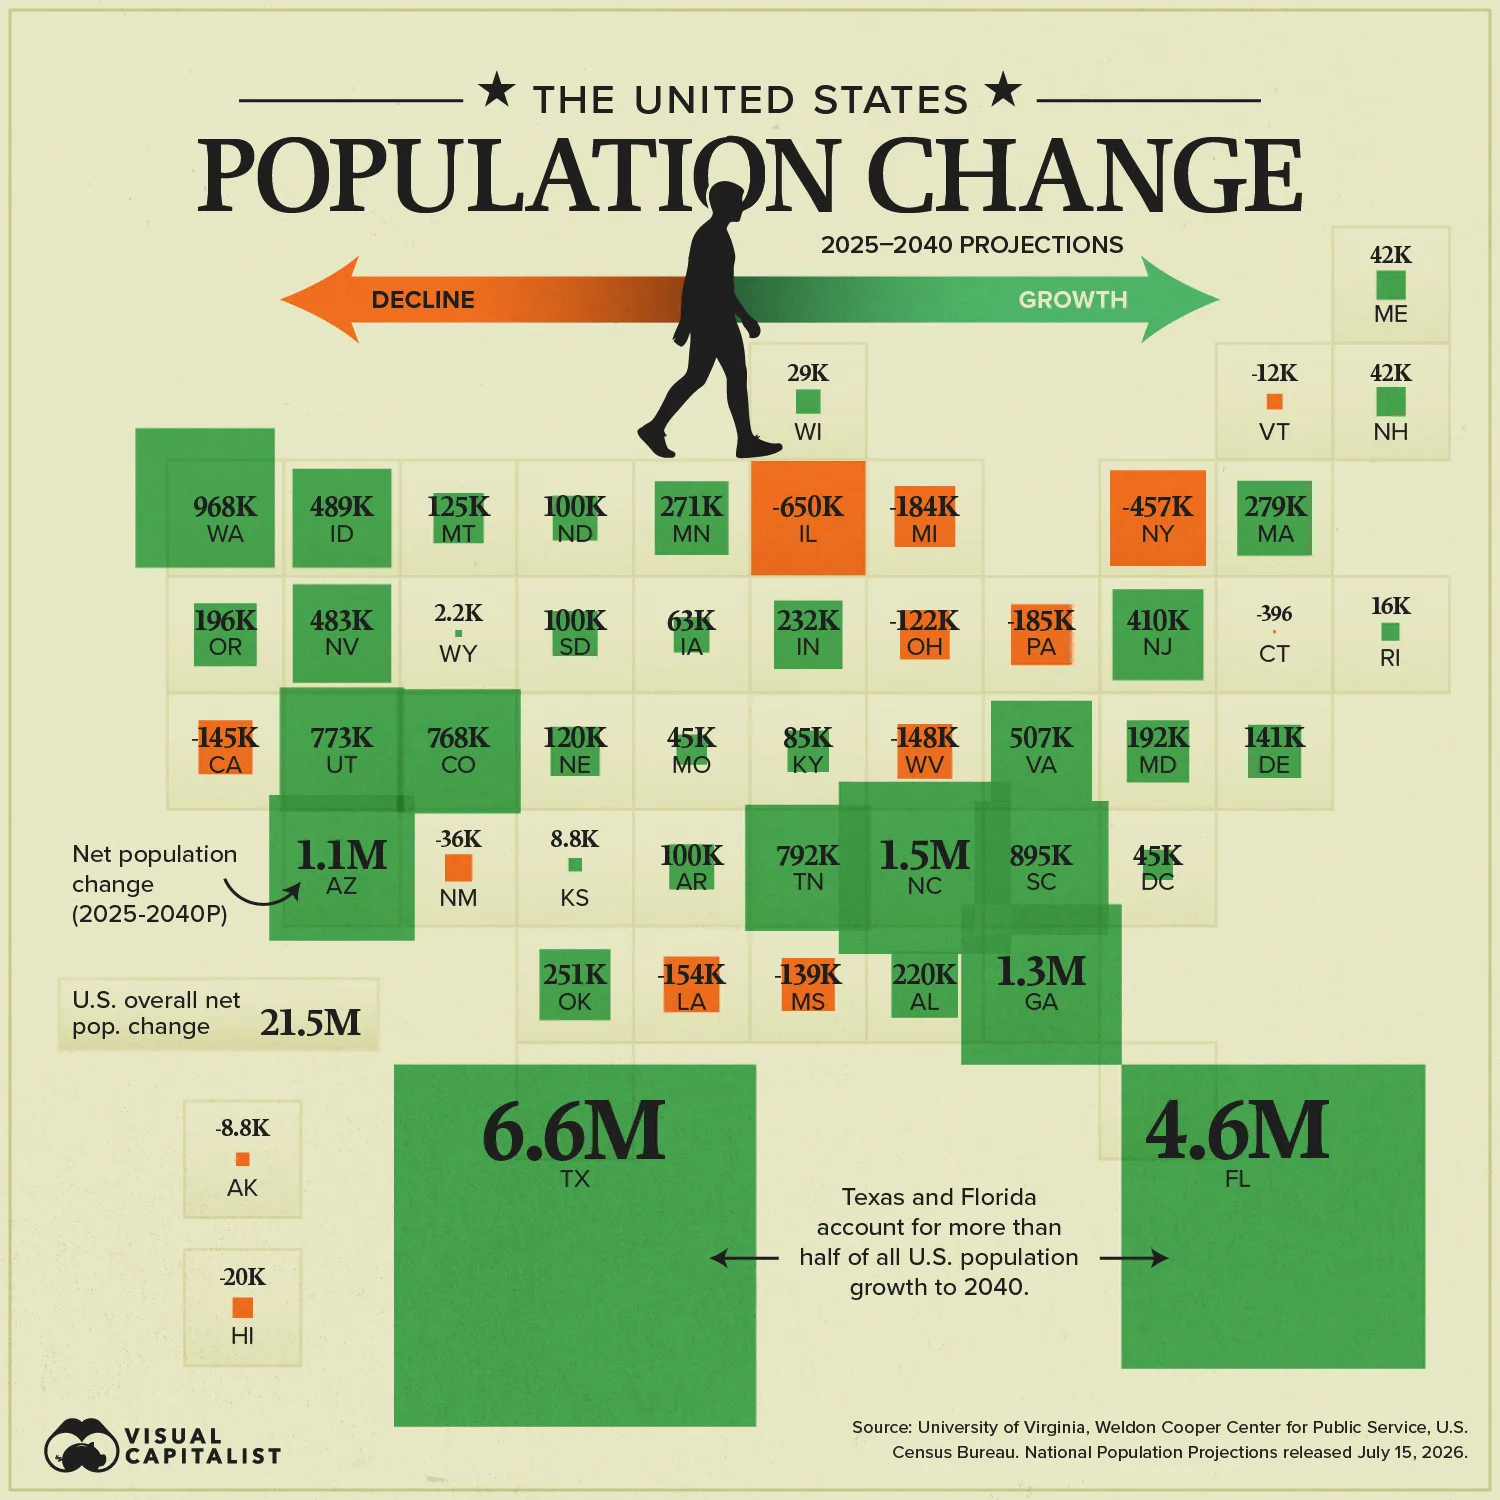
- The U.S. is projected to add 21.5 million people from 2025 to 2040, reaching 363.3 million.
- Texas and Florida account for 51.9% of the projected national increase, adding 11.2 million people combined.
- Fourteen states are projected to shrink, led by Illinois (-649,689) and New York (-456,879).
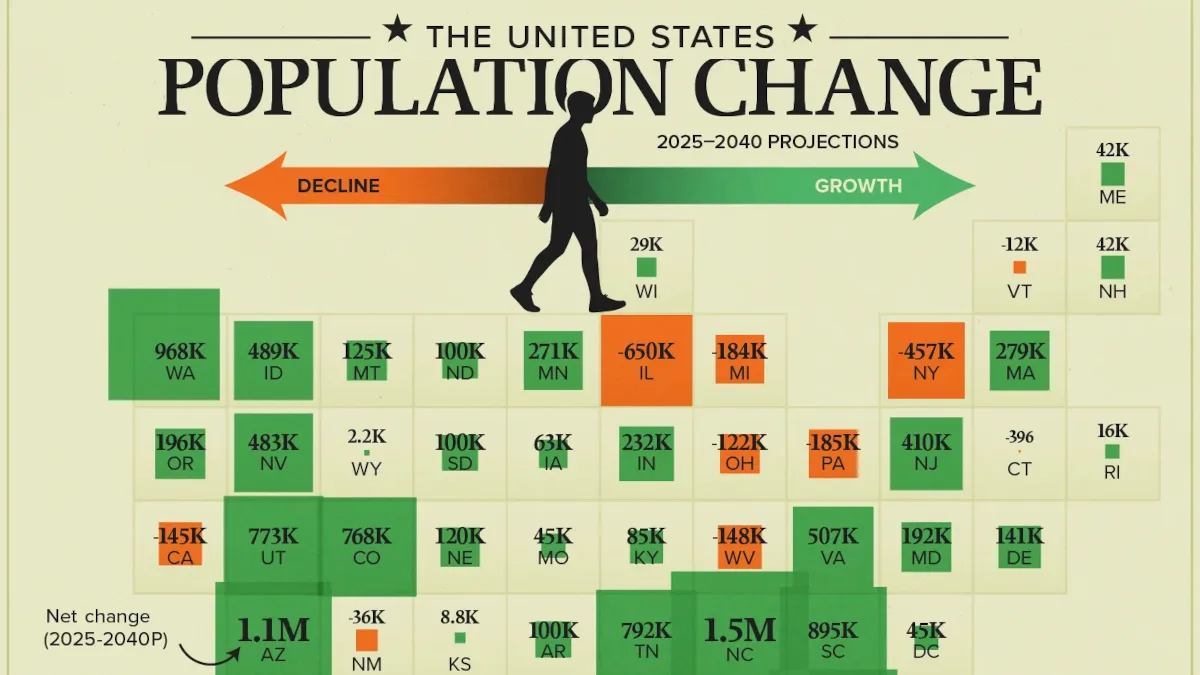
The U.S. population is projected to grow by 21.5 million people between 2025 and 2040, an increase of 6.3%. Yet more than half of that growth will be in just two states: Texas and Florida.
This visualization maps projected net population change across all 50 states and the District of Columbia using data from the University of Virginia’s Weldon Cooper Center for Public Service. Its 2040 projections are benchmarked to the 2020 Census and incorporate the U.S. Census Bureau’s 2025 population estimates.
Texas and Florida Drive Half of U.S. Population Growth by 2040
Texas is projected to add 6,559,670 residents by 2040, while Florida adds 4,621,619. Together, the two states supply 11,181,289 people, or more than half the entire projected U.S. increase.
The table below ranks all 50 states and D.C. by projected population change and shows each place’s percentage change from its 2025 estimate:
| Rank | State | Population Growth, 2025–2040 | |
|---|---|---|---|
| People | Change | ||
| 1 | Texas | 6,559,670 | 20.7% |
| 2 | Florida | 4,621,619 | 19.7% |
| 3 | North Carolina | 1,477,227 | 13.2% |
| 4 | Georgia | 1,284,018 | 11.4% |
| 5 | Arizona | 1,057,832 | 13.9% |
| 6 | Washington | 968,101 | 12.1% |
| 7 | South Carolina | 894,828 | 16.1% |
| 8 | Tennessee | 791,952 | 10.8% |
| 9 | Utah | 773,467 | 21.9% |
| 10 | Colorado | 768,298 | 12.8% |
| 11 | Virginia | 506,905 | 5.7% |
| 12 | Idaho | 488,619 | 24.1% |
| 13 | Nevada | 482,692 | 14.7% |
| 14 | New Jersey | 409,893 | 4.3% |
| 15 | Massachusetts | 278,669 | 3.9% |
| 16 | Minnesota | 270,623 | 4.6% |
| 17 | Oklahoma | 250,585 | 6.1% |
| 18 | Indiana | 232,269 | 3.3% |
| 19 | Alabama | 219,790 | 4.2% |
| 20 | Oregon | 196,194 | 4.6% |
| 21 | Maryland | 192,484 | 3.1% |
| 22 | Delaware | 141,134 | 13.3% |
| 23 | Montana | 124,693 | 10.9% |
| 24 | Nebraska | 119,582 | 5.9% |
| 25 | South Dakota | 100,460 | 10.7% |
| 26 | Arkansas | 100,277 | 3.2% |
| 27 | North Dakota | 99,521 | 12.5% |
| 28 | Kentucky | 84,811 | 1.8% |
| 29 | Iowa | 63,007 | 1.9% |
| 30 | Missouri | 45,267 | 0.7% |
| 31 | District of Columbia | 44,977 | 6.5% |
| 32 | Maine | 42,213 | 3.0% |
| 33 | New Hampshire | 41,632 | 2.9% |
| 34 | Wisconsin | 29,048 | 0.5% |
| 35 | Rhode Island | 15,656 | 1.4% |
| 36 | Kansas | 8,769 | 0.3% |
| 37 | Wyoming | 2,198 | 0.4% |
| 38 | Connecticut | -396 | 0.0% |
| 39 | Alaska | -8,841 | -1.2% |
| 40 | Vermont | -12,213 | -1.9% |
| 41 | Hawaii | -20,429 | -1.4% |
| 42 | New Mexico | -36,278 | -1.7% |
| 43 | Ohio | -122,089 | -1.0% |
| 44 | Mississippi | -138,951 | -4.7% |
| 45 | California | -144,900 | -0.4% |
| 46 | West Virginia | -147,952 | -8.4% |
| 47 | Louisiana | -153,837 | -3.3% |
| 48 | Michigan | -183,820 | -1.8% |
| 49 | Pennsylvania | -184,685 | -1.4% |
| 50 | New York | -456,879 | -2.3% |
| 51 | Illinois | -649,689 | -5.1% |
| — |  United States United States |
21,528,019 | 6.3% |
The South overall is projected to add 16.7 million people, representing 77.7% of total U.S. growth through 2040. The West adds another 4.7 million, while the Northeast and Midwest combined gain just 146,838 people, or 0.7% of the national increase.
This concentration extends a long-running regional shift. The Cooper Center’s broader outlook projects the South’s share of the U.S. population to rise from 38.1% in 2020 to 42.7% in 2050, while the shares of the Northeast and Midwest decline.
The Most Populous U.S. States in 2040
Based on these growth and decline numbers, which states will be the most populous in 15 years?
| Rank (2040) | State | Population (2025) | Population (2040P) |
|---|---|---|---|
| 1 | California | 39,355,309 | 39,210,409 |
| 2 | Texas | 31,709,821 | 38,269,491 |
| 3 | Florida | 23,462,518 | 28,084,137 |
| 4 | New York | 20,002,427 | 19,545,548 |
| 5 | Pennsylvania | 13,059,432 | 12,874,747 |
| 6 | North Carolina | 11,197,968 | 12,675,195 |
| 7 | Georgia | 11,302,748 | 12,586,766 |
| 8 | Illinois | 12,719,141 | 12,069,452 |
| 9 | Ohio | 11,900,510 | 11,778,421 |
| 10 | New Jersey | 9,548,215 | 9,958,108 |
| 11 | Michigan | 10,127,884 | 9,944,064 |
| 12 | Virginia | 8,880,107 | 9,387,012 |
| 13 | Washington | 8,001,020 | 8,969,121 |
| 14 | Arizona | 7,623,818 | 8,681,650 |
| 15 | Tennessee | 7,315,076 | 8,107,028 |
| 16 | Massachusetts | 7,154,084 | 7,432,753 |
| 17 | Indiana | 6,973,333 | 7,205,602 |
| 18 | Colorado | 6,012,561 | 6,780,859 |
| 19 | South Carolina | 5,570,274 | 6,465,102 |
| 20 | Maryland | 6,265,347 | 6,457,831 |
| 21 | Missouri | 6,270,541 | 6,315,808 |
| 22 | Minnesota | 5,830,405 | 6,101,028 |
| 23 | Wisconsin | 5,972,787 | 6,001,835 |
| 24 | Alabama | 5,193,088 | 5,412,878 |
| 25 | Kentucky | 4,606,864 | 4,691,675 |
| 26 | Oregon | 4,273,586 | 4,469,780 |
| 27 | Louisiana | 4,618,189 | 4,464,352 |
| 28 | Oklahoma | 4,123,288 | 4,373,873 |
| 29 | Utah | 3,538,904 | 4,312,371 |
| 30 | Nevada | 3,282,188 | 3,764,880 |
| 31 | Connecticut | 3,688,496 | 3,688,100 |
| 32 | Iowa | 3,238,387 | 3,301,394 |
| 33 | Arkansas | 3,114,791 | 3,215,068 |
| 34 | Kansas | 2,977,220 | 2,985,989 |
| 35 | Mississippi | 2,954,160 | 2,815,209 |
| 36 | Idaho | 2,029,733 | 2,518,352 |
| 37 | Nebraska | 2,018,006 | 2,137,588 |
| 38 | New Mexico | 2,125,498 | 2,089,220 |
| 39 | West Virginia | 1,766,147 | 1,618,195 |
| 40 | Maine | 1,414,874 | 1,457,087 |
| 41 | New Hampshire | 1,415,342 | 1,456,974 |
| 42 | Hawaii | 1,432,820 | 1,412,391 |
| 43 | Montana | 1,144,694 | 1,269,387 |
| 44 | Delaware | 1,059,952 | 1,201,086 |
| 45 | Rhode Island | 1,114,521 | 1,130,177 |
| 46 | South Dakota | 935,094 | 1,035,554 |
| 47 | North Dakota | 799,358 | 898,879 |
| 48 | District of Columbia | 693,645 | 738,622 |
| 49 | Alaska | 737,270 | 728,429 |
| 50 | Vermont | 644,663 | 632,450 |
| 51 | Wyoming | 588,753 | 590,951 |
| — | United States |
341,784,857 | 363,312,876 |
California will remain at the top with 39.2 million people, but Texas will almost catch right up as it hits 38.3 million people by the year 2040.
Fourteen States Are Projected to Shrink
Illinois (-649,689) and New York (-456,879) lead the projected losses, but the broader pattern is regional.
Seven of the 14 shrinking states sit in the older industrial North: Illinois, Michigan, and Ohio around the Great Lakes, plus New York, Pennsylvania, Vermont, and Connecticut in the Northeast. Together, those seven account for more than 70% of all projected state losses.
A second cluster runs through the South, where West Virginia, Mississippi, and Louisiana are projected to lose more than 440,000 people combined. California is the outlier on the map’s western edge: its projected decline of roughly 145,000 is small for a state of 39 million, but it marks a reversal for a state that grew in every decade of the last century.
The two engines of decline work together. Aging populations mean less natural growth, with recent data showing that deaths now outnumber births in 17 U.S. states, leaving migration as the deciding factor.
At the same time, the domestic migration that fuels the Sun Belt’s gains pulls hardest from these same states, as residents move toward jobs, cheaper housing, and warmer climates in Texas, Florida, and the broader South.
Learn More on the Voronoi App
If you enjoyed today’s post, check out Mapped: States With the Most Children as a Share of the Population on Voronoi.