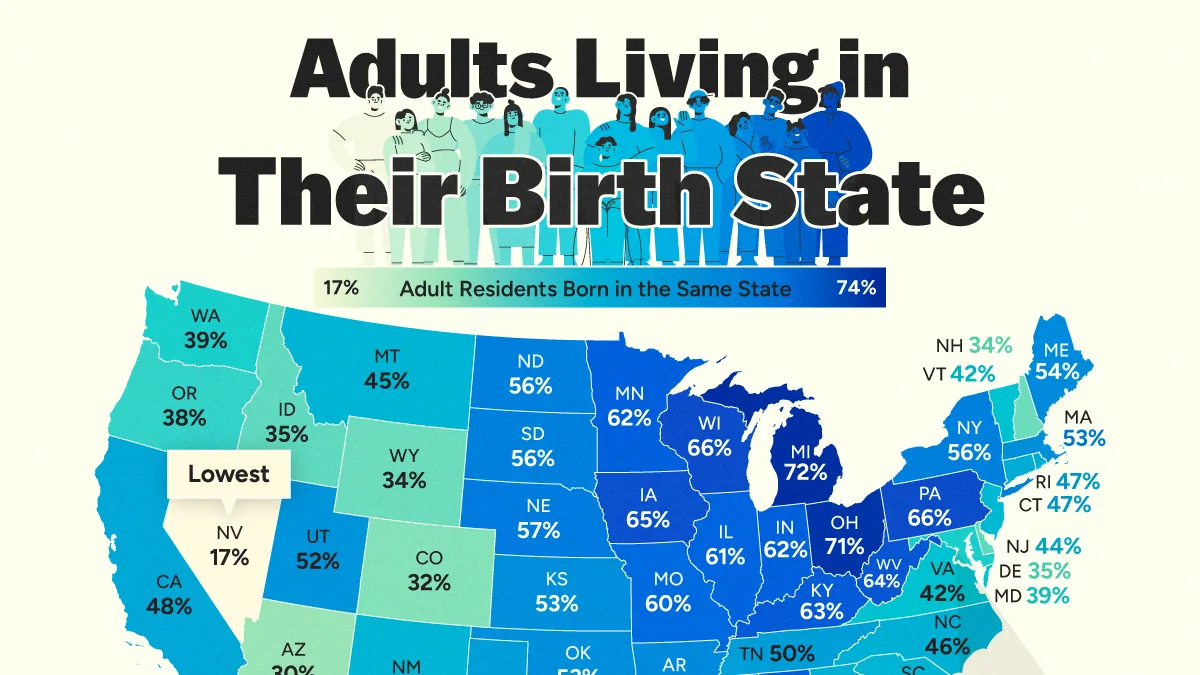
Mapped: Adults Living in Their Birth State
Key Takeaways
- Louisiana had the highest share of adult residents born in-state of any U.S. state in 2024, at 74%.
- Nevada had the lowest share at just 17%, reflecting decades of rapid population growth and in-migration.
- Nationwide, 49% of U.S. adults live in the state where they were born.
Where people live as adults can reveal a lot about a state’s population dynamics.
Some states have large shares of locally born residents, while others have much lower shares, often reflecting stronger in-migration from elsewhere in the country or abroad.
Overall, the figure for each state reflects two forces: how many current residents were born locally and how many newcomers the state has attracted.
This visualization maps the share of adults in each U.S. state who lived in the state where they were born in 2024, the latest data available as of August 2026. The data for this visualization comes from the U.S. Census Bureau’s 2024 American Community Survey 1-Year Estimates.
Louisiana Has America’s Highest Share of Locally Born Adults
Despite net negative domestic migration from the state, Louisiana ranks first among all states, with 73.9% of its current adult residents born there as of 2024.
Michigan and Ohio follow closely, at 72% and 71%, respectively. These are the only three states where at least seven in 10 adults were born in the same state where they live today.
The table below ranks all 50 states and the District of Columbia by the share of adults living in the state where they were born:
| Rank | State | Share of Adult Residents Born in the Same State (%) |
|---|---|---|
| 1 | Louisiana | 74 |
| 2 | Michigan | 72 |
| 3 | Ohio | 71 |
| 4 | Mississippi | 67 |
| 5 | Pennsylvania | 66 |
| 6 | Wisconsin | 66 |
| 7 | Iowa | 65 |
| 8 | West Virginia | 64 |
| 9 | Kentucky | 63 |
| 10 | Alabama | 62 |
| 11 | Indiana | 62 |
| 12 | Minnesota | 62 |
| 13 | Illinois | 61 |
| 14 | Missouri | 60 |
| 15 | Nebraska | 57 |
| 16 | South Dakota | 56 |
| 17 | North Dakota | 56 |
| 18 | New York | 56 |
| 19 | Arkansas | 54 |
| 20 | Maine | 54 |
| 21 | Oklahoma | 53 |
| 22 | Kansas | 53 |
| 23 | Massachusetts | 53 |
| 24 | Utah | 52 |
| 25 | Tennessee | 50 |
| 26 | Texas | 50 |
| 27 | California | 48 |
| 28 | Connecticut | 47 |
| 29 | Hawaii | 47 |
| 30 | Rhode Island | 47 |
| 31 | North Carolina | 46 |
| 32 | Georgia | 46 |
| 33 | South Carolina | 45 |
| 34 | New Mexico | 45 |
| 35 | Montana | 45 |
| 36 | New Jersey | 44 |
| 37 | Vermont | 42 |
| 38 | Virginia | 42 |
| 39 | Maryland | 39 |
| 40 | Washington | 39 |
| 41 | Oregon | 38 |
| 42 | Idaho | 35 |
| 43 | Delaware | 35 |
| 44 | New Hampshire | 34 |
| 45 | Wyoming | 34 |
| 46 | Alaska | 33 |
| 47 | Colorado | 32 |
| 48 | Arizona | 30 |
| 49 | Florida | 26 |
| 50 | District of Columbia | 25 |
| 51 | Nevada | 17 |
Many of the highest-ranking states are in the Midwest and South. Michigan, Ohio, Wisconsin, and Iowa rank near the top, as do Louisiana, Mississippi, West Virginia, Kentucky, and Alabama.
Pennsylvania also ranks highly, with 66% of adult residents born in the state.
Western states generally rank much lower.
One of the leading reasons adults remain in their home communities is family: among those who never left, 35% cited staying near family as a main reason.
Half of States Are Below the 50% Mark
Across the U.S., nearly one in two adults lived in their birth state in 2024, amounting to 133.7 million American adults.
Beginning with Texas at 49.7%, 25 states and D.C. had shares below 50%.
The remaining 25 states were at or above that threshold, meaning the country is almost evenly split between states where a majority of adults were born locally and those where a majority were born elsewhere.
Reasons for moving to another state often include economic factors such as better job opportunities and more affordable living arrangements, along with lifestyle and social factors.
Nevada and Florida Stand Out for In-Migration
Nevada had the lowest share in the country, with just 17% of its adult residents born in-state.
Its unusually low share reflects Nevada’s long history of rapid population growth. Between 1970 and 2025, its population increased by 572%, the largest gain of any state over that period.
However, a low share does not measure current in-migration by itself. It reflects the cumulative composition of a state’s adult population, including decades of migration and population growth.
Florida also ranked near the bottom, at 25.8%. Despite having 18.9 million adult residents, only 4.9 million were born in Florida.
Other low-ranking states include Arizona at 29.5%, Colorado at 31.9%, and Alaska at 32.6%. These states have been shaped by factors including retirement migration, job-driven moves, and more recent periods of large-scale population growth compared with many states in the Midwest and South.
Learn More on the Voronoi App
If you enjoyed this post, check out Mapped: The Population of U.S. States Compared with Countries on Voronoi.