The Best and Worst Months to Book a Hotel in U.S. Cities
Key Takeaways
- Hotel rates can vary dramatically by season, with New York showing a 103% swing between its cheapest and most expensive months.
- Phoenix hotels are cheapest in August at $96 per night, compared with $246 in February and March.
- Los Angeles has the smallest seasonal swing among the 20 cities shown, at just 14%.
If you’ve booked a hotel lately, you know that it’s a game of roulette.
One month it seems like you get a screaming deal, but then the next time you book, prices have mysteriously skyrocketed. Is it seasonal or is that by chance?
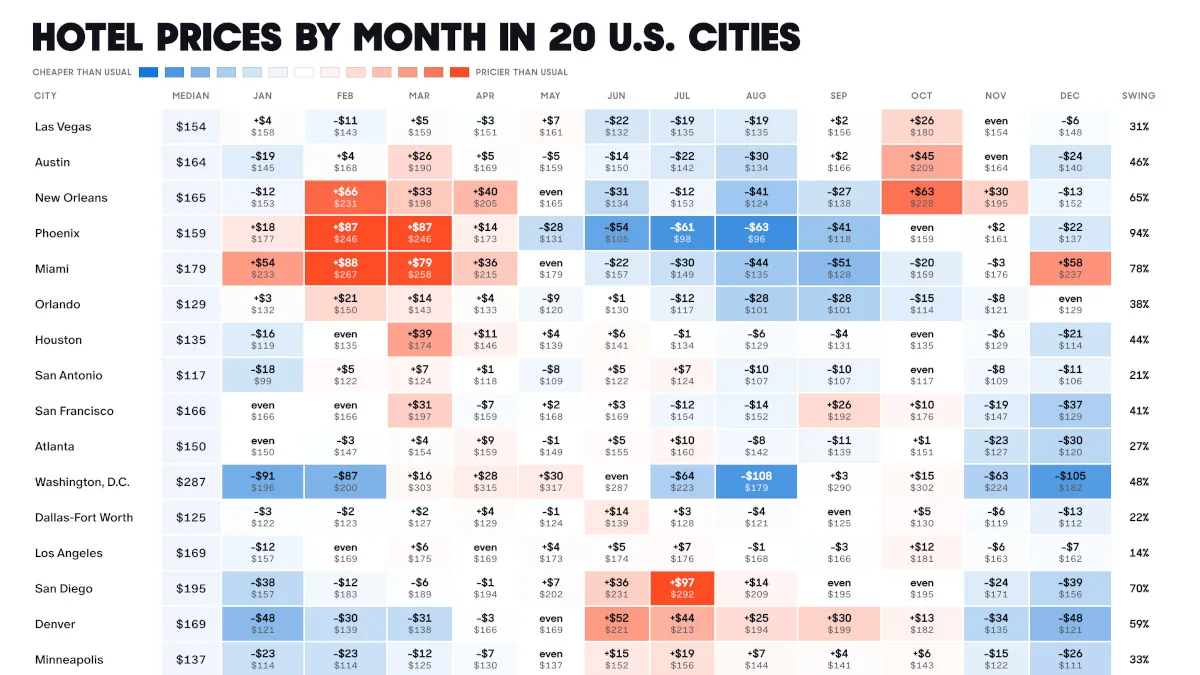
This visualization helps explain some of that variance by breaking down the best and worst months to book a hotel in U.S. cities.
The data and visualization both come from business travel company Engine, which put together a proprietary dataset on hotel prices by month for 50 U.S. cities using 129 million data points.
Highs and Lows of Hotel Prices by U.S. City
The table below summarizes the cheapest and most expensive months for the 20 cities shown above, along with each city’s median nightly rate and seasonal price swing.
For readers looking beyond these major markets, the complete dataset for all 50 cities appears at the bottom of this post.
| City | Cheapest Month | Median Rate | Most Expensive Month | Swing |
|---|---|---|---|---|
| New York | Jan: $196 | $335 | Dec: $541 | 103% |
| Phoenix | Aug: $96 | $159 | Feb/Mar: $246 | 94% |
| Boston | Jan: $166 | $331 | Oct: $458 | 88% |
| Miami | Sep: $128 | $179 | Feb: $267 | 78% |
| San Diego | Dec: $156 | $195 | Jul: $292 | 70% |
| Chicago | Jan: $127 | $274 | Jun: $319 | 70% |
| New Orleans | Aug: $124 | $165 | Feb: $231 | 65% |
| Denver | Jan/Dec: $121 | $169 | Jun: $221 | 59% |
| Nashville | Jan: $136 | $195 | Oct: $243 | 55% |
| Washington, D.C. | Aug: $179 | $287 | May: $317 | 48% |
| Austin | Aug: $134 | $164 | Oct: $209 | 46% |
| Houston | Dec: $114 | $135 | Mar: $174 | 44% |
| San Francisco | Dec: $129 | $166 | Mar: $197 | 41% |
| Orlando | Aug/Sep: $101 | $129 | Feb: $150 | 38% |
| Minneapolis | Dec: $111 | $137 | Jul: $156 | 33% |
| Las Vegas | Jun: $132 | $154 | Oct: $180 | 31% |
| Atlanta | Dec: $120 | $150 | Jul: $160 | 27% |
| Dallas–Fort Worth | Dec: $112 | $125 | Jun: $139 | 22% |
| San Antonio | Jan: $99 | $117 | Mar/Jul: $124 | 21% |
| Los Angeles | Jan: $157 | $169 | Oct: $181 | 14% |
The swing percentage is calculated as the priciest month minus the least expensive month, divided by the median price.
Cities With the Biggest Price Swings
The three cities with the biggest seasonal price swings in the dataset are New York (103%), Phoenix (94%), and Boston (88%).
The Big Apple has the most interesting contrast here, especially as the most visited city in the country. In December, it costs a high of $541 to book a hotel, but in January, after Christmas and New Year’s celebrations are over, that drops to a low of $196.
Similarly, January is the cheapest time to go to Boston ($166), with its priciest month being October ($458).
Phoenix shows the opposite pattern because of how hot the desert is in summer. Hotel prices plummet to $96 per night in August, but during the winter months of February and March, hotel prices peak at $246.
Cities That Have the Least Variance
But not all U.S. cities have intense seasonal variance. For these U.S. cities, there is no real best or worst month to book a hotel.
Los Angeles, with year-round good weather, is the clearest example in the dataset, with just 14% variance in hotel prices. The cheapest month for a hotel is January ($157), but it only costs $24 more per night to book in the most expensive month, October ($181).
Two cities in Texas, San Antonio and Dallas-Fort Worth, also show little variance by month in hotel prices, at 21% and 22%, respectively.
The Full Data Set for 50 Cities
Below is the full dataset for all 50 cities.
| City | Median | Jan | Feb | Mar | Apr | May | Jun | Jul | Aug | Sep | Oct | Nov | Dec | Swing |
|---|---|---|---|---|---|---|---|---|---|---|---|---|---|---|
| New York | 335 | 196 | 202 | 277 | 335 | 372 | 327 | 268 | 273 | 458 | 429 | 352 | 541 | 103% |
| Palm Springs | 204 | 241 | 288 | 369 | 359 | 204 | 171 | 161 | 158 | 171 | 198 | 228 | 204 | 103% |
| Phoenix | 159 | 177 | 246 | 246 | 173 | 131 | 105 | 98 | 96 | 118 | 159 | 161 | 137 | 94% |
| Norfolk | 129 | 96 | 99 | 116 | 129 | 151 | 178 | 216 | 194 | 130 | 123 | 105 | 101 | 93% |
| Boston | 331 | 166 | 186 | 267 | 331 | 390 | 368 | 332 | 314 | 434 | 458 | 301 | 187 | 88% |
| Omaha | 110 | 98 | 106 | 105 | 110 | 126 | 182 | 120 | 115 | 110 | 111 | 102 | 95 | 79% |
| Miami | 179 | 233 | 267 | 258 | 215 | 179 | 157 | 149 | 135 | 128 | 159 | 176 | 237 | 78% |
| Seattle | 212 | 139 | 150 | 159 | 169 | 213 | 279 | 297 | 272 | 253 | 212 | 165 | 142 | 75% |
| Chicago | 274 | 127 | 139 | 188 | 204 | 305 | 319 | 274 | 280 | 300 | 293 | 208 | 154 | 70% |
| Milwaukee | 130 | 109 | 108 | 117 | 123 | 132 | 163 | 194 | 158 | 136 | 130 | 114 | 103 | 70% |
| San Diego | 195 | 157 | 183 | 189 | 194 | 202 | 231 | 292 | 209 | 195 | 195 | 171 | 156 | 70% |
| New Orleans | 165 | 153 | 231 | 198 | 205 | 165 | 134 | 153 | 124 | 138 | 228 | 195 | 152 | 65% |
| Denver | 169 | 121 | 139 | 138 | 166 | 169 | 221 | 213 | 194 | 199 | 182 | 135 | 121 | 59% |
| Tampa | 167 | 199 | 233 | 224 | 212 | 167 | 152 | 143 | 135 | 135 | 152 | 159 | 168 | 59% |
| Nashville | 195 | 136 | 152 | 178 | 197 | 196 | 215 | 185 | 195 | 220 | 243 | 187 | 146 | 55% |
| Albuquerque | 131 | 111 | 116 | 127 | 131 | 134 | 136 | 131 | 127 | 134 | 179 | 117 | 111 | 52% |
| Charleston | 173 | 123 | 145 | 199 | 205 | 208 | 196 | 195 | 173 | 164 | 167 | 152 | 123 | 49% |
| Washington, D.C. | 287 | 196 | 200 | 303 | 315 | 317 | 287 | 223 | 179 | 290 | 302 | 224 | 182 | 48% |
| Philadelphia | 203 | 166 | 169 | 203 | 222 | 259 | 244 | 199 | 183 | 212 | 246 | 197 | 162 | 48% |
| Austin | 164 | 145 | 168 | 190 | 169 | 159 | 150 | 142 | 134 | 166 | 209 | 164 | 140 | 46% |
| Houston | 135 | 119 | 135 | 174 | 146 | 139 | 141 | 134 | 129 | 131 | 135 | 129 | 114 | 44% |
| San Francisco | 166 | 166 | 166 | 197 | 159 | 168 | 169 | 154 | 152 | 192 | 176 | 147 | 129 | 41% |
| Indianapolis | 125 | 114 | 107 | 122 | 133 | 158 | 140 | 155 | 125 | 117 | 134 | 122 | 112 | 41% |
| Cincinnati | 133 | 106 | 108 | 118 | 139 | 133 | 152 | 156 | 142 | 135 | 125 | 110 | 104 | 39% |
| Orlando | 129 | 132 | 150 | 143 | 133 | 120 | 130 | 117 | 101 | 101 | 114 | 121 | 129 | 38% |
| Pittsburgh | 158 | 131 | 131 | 134 | 169 | 180 | 191 | 156 | 158 | 172 | 183 | 150 | 135 | 38% |
| Cleveland | 158 | 124 | 124 | 139 | 146 | 158 | 173 | 183 | 173 | 178 | 158 | 141 | 128 | 37% |
| Minneapolis | 137 | 114 | 114 | 125 | 130 | 137 | 152 | 156 | 144 | 141 | 143 | 122 | 111 | 33% |
| Salt Lake City | 141 | 125 | 127 | 141 | 151 | 154 | 160 | 143 | 135 | 148 | 136 | 121 | 115 | 32% |
| Las Vegas | 154 | 158 | 143 | 159 | 151 | 161 | 132 | 135 | 135 | 156 | 180 | 154 | 148 | 31% |
| Louisville | 141 | 106 | 134 | 144 | 147 | 144 | 127 | 144 | 124 | 149 | 141 | 118 | 110 | 30% |
| Detroit | 197 | 168 | 170 | 170 | 188 | 214 | 214 | 218 | 197 | 212 | 228 | 171 | 168 | 30% |
| Portland | 125 | 109 | 118 | 116 | 120 | 127 | 143 | 145 | 139 | 128 | 125 | 114 | 109 | 29% |
| Atlanta | 150 | 150 | 147 | 154 | 159 | 149 | 155 | 160 | 142 | 139 | 151 | 127 | 120 | 27% |
| St. Louis | 156 | 129 | 136 | 161 | 162 | 161 | 170 | 167 | 154 | 156 | 144 | 142 | 131 | 26% |
| Jacksonville | 121 | 119 | 126 | 142 | 126 | 127 | 118 | 121 | 113 | 111 | 119 | 118 | 121 | 26% |
| Kansas City | 142 | 117 | 123 | 132 | 146 | 149 | 153 | 146 | 134 | 142 | 146 | 135 | 125 | 25% |
| Oklahoma City | 97 | 90 | 90 | 98 | 102 | 108 | 111 | 99 | 97 | 97 | 93 | 93 | 87 | 25% |
| Savannah | 138 | 118 | 137 | 152 | 149 | 148 | 148 | 136 | 126 | 138 | 144 | 133 | 121 | 25% |
| Baltimore | 142 | 118 | 128 | 127 | 134 | 147 | 152 | 146 | 142 | 144 | 144 | 125 | 118 | 24% |
| Columbus | 127 | 110 | 110 | 119 | 119 | 141 | 128 | 135 | 127 | 127 | 127 | 122 | 110 | 24% |
| Honolulu | 184 | 182 | 193 | 178 | 180 | 180 | 204 | 211 | 198 | 184 | 177 | 169 | 211 | 23% |
| Dallas–Fort Worth | 125 | 122 | 123 | 127 | 129 | 124 | 139 | 128 | 121 | 125 | 130 | 119 | 112 | 22% |
| Sacramento | 148 | 140 | 140 | 147 | 148 | 148 | 159 | 168 | 159 | 148 | 166 | 136 | 137 | 22% |
| Raleigh–Durham | 135 | 119 | 125 | 130 | 135 | 140 | 143 | 133 | 130 | 135 | 148 | 135 | 129 | 21% |
| San Antonio | 117 | 99 | 122 | 124 | 118 | 109 | 122 | 124 | 107 | 107 | 117 | 109 | 106 | 21% |
| Charlotte | 131 | 120 | 126 | 128 | 133 | 145 | 139 | 132 | 129 | 131 | 137 | 131 | 125 | 19% |
| Memphis | 118 | 107 | 112 | 123 | 118 | 124 | 118 | 122 | 117 | 115 | 117 | 119 | 103 | 18% |
| Los Angeles | 169 | 157 | 169 | 175 | 169 | 173 | 174 | 176 | 168 | 166 | 181 | 163 | 162 | 14% |
| El Paso | 126 | 119 | 123 | 128 | 126 | 121 | 130 | 118 | 123 | 127 | 128 | 127 | 117 | 10% |
For further analysis, we recommend checking out Engine’s original post, which includes some interactive data visualizations as well.
Learn More on the Voronoi App 
What type of accommodation do Americans opt for when travelling? This visual on Voronoi compares hotels against other types of accommodation like vacation apartments, cruises, and motorhomes.