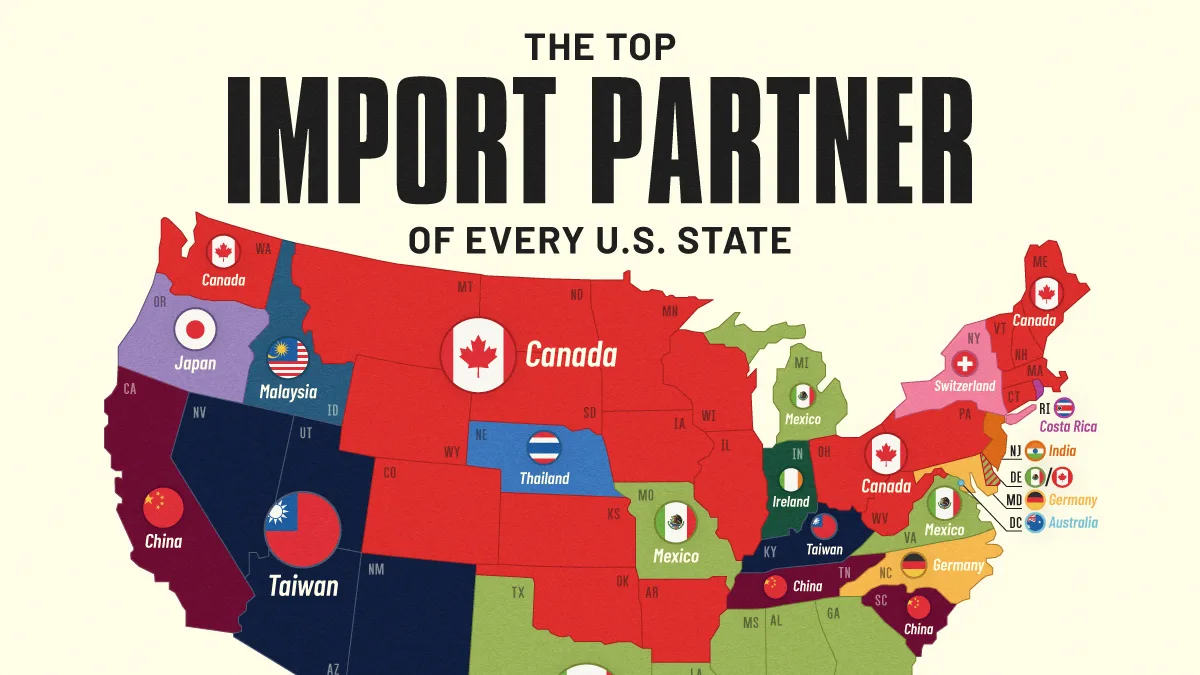
Mapped: The Top Import Partner of Every U.S. State
Key Takeaways
- Canada is the top import partner of 23 U.S. states, more than any other country.
- Mexico ranks first for nine states, while Taiwan leads in five and China in four.
- Some states have unexpected top partners, including Ireland for Indiana, Thailand for Nebraska, and Malaysia for Idaho.
Trade relationships vary widely by state, shaped by factors such as geography, industry, and infrastructure.
Using 2025 data from the U.S. Census Bureau, this map shows the country from which each state imports the most goods, based on NAICS-3 goods classifications.
Which Countries U.S. States Import the Most From
In 2025, Canada was the top import partner of 23 states, more than any other country.
Many are northern border states, including Montana, Maine, Vermont, and Washington. However, Canada’s reach extends farther south to states such as Oklahoma and Colorado.
| State or District | Top Import Partner (2025) |
Imports from Top Partner ($B) |
Total Imports ($B) | Share From Top Partner |
|---|---|---|---|---|
| Montana |  Canada Canada |
5.7 | 6.3 | 91.4% |
| Vermont | Canada |
2.8 | 4.0 | 70.0% |
| Maine | Canada |
4.1 | 6.0 | 68.7% |
| North Dakota | Canada |
2.7 | 3.9 | 67.6% |
| Wyoming | Canada |
0.5 | 1.0 | 48.7% |
| Michigan |  Mexico Mexico |
78.9 | 167.1 | 47.2% |
| Oklahoma | Canada |
7.8 | 17.1 | 45.9% |
| Nevada |  Taiwan Taiwan |
16.3 | 36.1 | 45.2% |
| Texas | Mexico |
177.1 | 411.2 | 43.1% |
| Indiana |  Ireland Ireland |
64.7 | 153.1 | 42.3% |
| Alaska | Canada |
1.3 | 3.1 | 40.7% |
| West Virginia | Canada |
1.8 | 4.9 | 37.7% |
| Nebraska |  Thailand Thailand |
2.9 | 8.0 | 36.7% |
| South Dakota | Canada |
0.6 | 1.5 | 36.0% |
| New Mexico | Taiwan |
4.2 | 12.2 | 34.2% |
| Minnesota | Canada |
12.5 | 37.3 | 33.5% |
| Colorado | Canada |
5.3 | 16.4 | 32.5% |
| Idaho |  Malaysia Malaysia |
2.3 | 7.1 | 32.5% |
| DC |  Australia Australia |
0.3 | 1.1 | 31.7% |
| Arizona | Taiwan |
16.7 | 57.3 | 29.1% |
| Washington | Canada |
15.8 | 55.5 | 28.6% |
| Illinois | Canada |
58.3 | 210.9 | 27.7% |
| New York |  Switzerland Switzerland |
58.6 | 213.9 | 27.4% |
| Iowa | Canada |
3.2 | 12.0 | 26.6% |
| Connecticut | Canada |
5.7 | 24.0 | 23.8% |
| Massachusetts | Canada |
10.0 | 42.8 | 23.3% |
| Missouri | Mexico |
5.1 | 21.8 | 23.3% |
| Hawaii |  South Korea South Korea |
0.6 | 2.7 | 22.6% |
| Utah | Taiwan |
6.0 | 28.6 | 20.8% |
| New Hampshire | Canada |
1.9 | 10.1 | 19.2% |
| Ohio | Canada |
16.3 | 87.1 | 18.7% |
| Alabama | Mexico |
6.5 | 35.0 | 18.6% |
| Rhode Island |  Costa Rica Costa Rica |
2.1 | 11.3 | 18.2% |
| Oregon |  Japan Japan |
5.3 | 30.8 | 17.1% |
| Maryland |  Germany Germany |
6.8 | 41.4 | 16.5% |
| Arkansas | Canada |
1.1 | 6.7 | 16.0% |
| North Carolina | Germany |
16.2 | 102.0 | 15.9% |
| California |  China China |
76.1 | 488.1 | 15.6% |
| Georgia | Mexico |
23.4 | 150.5 | 15.6% |
| Wisconsin | Canada |
5.7 | 36.5 | 15.6% |
| Kansas | Canada |
2.0 | 13.9 | 14.2% |
| Mississippi | Mexico |
3.1 | 23.0 | 13.3% |
| South Carolina | China |
7.5 | 56.2 | 13.3% |
| Virginia | Mexico |
5.8 | 43.6 | 13.2% |
| Kentucky | Taiwan |
11.0 | 96.9 | 11.4% |
| Tennessee | China |
13.0 | 119.5 | 10.9% |
| Louisiana | Mexico |
3.6 | 33.6 | 10.7% |
| Pennsylvania | Canada |
13.4 | 136.2 | 9.8% |
| Delaware | Canada/Mexico |
1.0 | 10.4 | 9.5% |
| Florida | China |
9.4 | 115.9 | 8.1% |
| New Jersey |  India India |
11.5 | 147.8 | 7.8% |
Mexico ranks second, serving as the top import partner of nine states. Canada and Mexico are tied as Delaware’s top import partners, with the state importing exactly $988 million in goods from each.
Taiwan ranks first in five states and China in four. Meanwhile, countries like Australia, Switzerland, Japan, and Costa Rica each appear as the top import partner of just one state.
The Countries States Are Most Reliant On
The share of imports coming from a state’s top trade partner varies dramatically.
New Jersey has the lowest concentration in a single top partner. India is its largest source of imports, but its $11.5 billion in goods represents just 7.8% of New Jersey’s $147.8 billion in total imports.
At the other extreme, Montana imports 91.4% of its goods from Canada. This concentration could leave the state more exposed to tariffs, trade disputes, or changes in the price and availability of goods.
The five states most reliant on their top import partner are Montana (91.4%), Vermont (70.0%), Maine (68.7%), North Dakota (67.6%), and Wyoming (48.7%). Canada is the top partner for all five.
Learn More on the Voronoi App
See how trade volumes have changed by country since 2019 in this visualization on the Voronoi App.