The World’s $160 Trillion Debt Market in One Chart
Key Takeaways
- The U.S. has the world’s largest debt securities market at $61.2 trillion.
- The U.S., EU, and China together account for 75.4% of the global market.
- China’s debt securities market has grown roughly 3.7-fold since 2015.
The global market for bonds and other tradable debt reached $160.7 trillion in 2025, spanning securities issued by governments, financial institutions, and nonfinancial corporations.
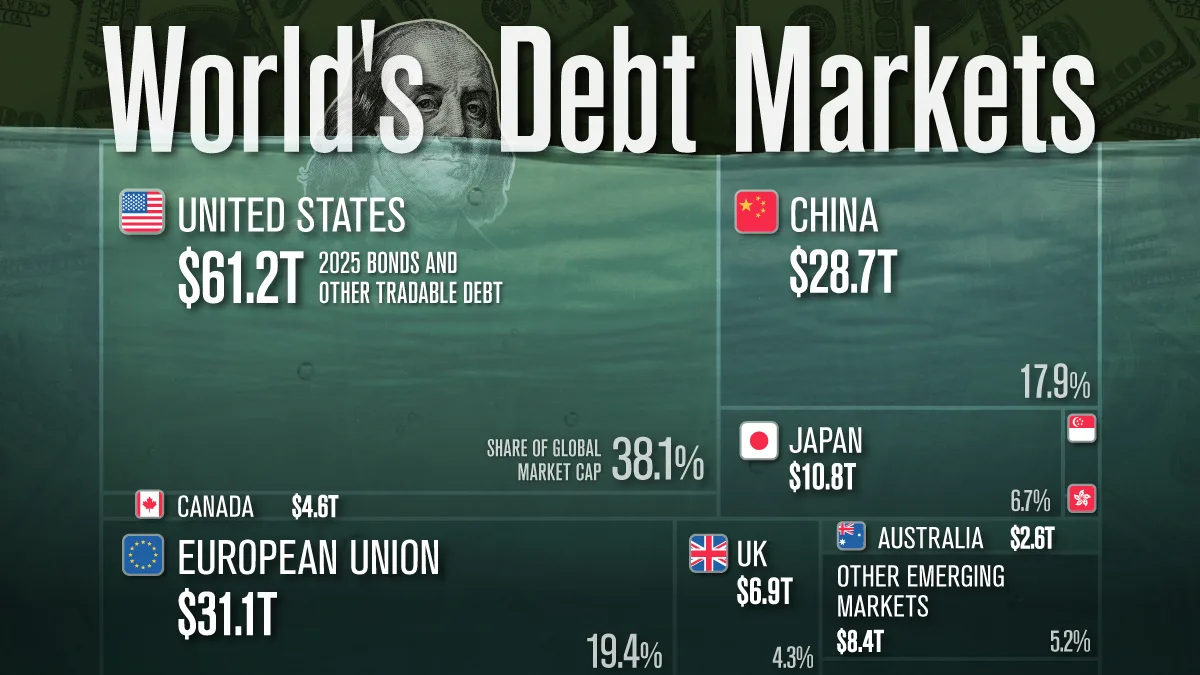
This visualization ranks the world’s major debt markets by the value of outstanding debt securities in 2025. Data has been sourced from the Bank for International Settlements via SIFMA.
The graphic excludes loans and other nonsecuritized debt.
America’s Debt Market Dominance
At $61.2 trillion, the U.S. debt securities market is almost twice the size of the European Union’s ($31.1 trillion). It is also about $1.4 trillion larger than the EU and China ($28.7 trillion) combined.
The table below lists the world’s major debt markets as of the end of 2025.
| Country | Market cap in 2025 ($T) | Share of global market (%) |
|---|---|---|
 United States United States |
61.2 | 38.1 |
 EU EU |
31.1 | 19.4 |
 China China |
28.7 | 17.9 |
 Japan Japan |
10.8 | 6.7 |
 United Kingdom United Kingdom |
6.9 | 4.3 |
 Canada Canada |
4.6 | 2.9 |
 Australia Australia |
2.6 | 1.6 |
 Singapore Singapore |
0.9 | 0.6 |
 Switzerland Switzerland |
1.0 | 0.6 |
 Hong Kong Hong Kong |
0.2 | 0.2 |
| Other Emerging Markets | 8.4 | 5.2 |
| Other Developed Markets | 4.1 | 2.6 |
 Total Total |
160.7 | 100.0 |
The $61 trillion figure reflects more than simply the massive U.S. government debt. The source measurement also includes securities issued by financial and nonfinancial corporations.
America is also unusually reliant on securities markets for corporate financing. Debt securities account for over three-quarters of U.S. nonfinancial corporate debt financing, whereas bank lending averages 85% across China, Japan, the United Kingdom, and the euro area.
China’s Massive Debt Market
China has the world’s second-largest national debt securities market at $28.7 trillion, nearly triple the size of Japan’s $10.8 trillion market.
Its rise over the past decade has been substantial. China’s market has grown from $7.8 trillion in 2015 to $28.7 trillion in 2025, while its share of the global total has increased from 9.2% to 17.9%.
For more context on this growth, see this earlier visualization.
The Concentration of Global Debt Markets
The global debt securities market is highly concentrated: the U.S., EU, and China together account for 75.4% of the total. Adding Japan brings the share to 82.1%.
However, the balance shifted in 2025. Despite U.S. outstanding securities rising 5.2%, the country’s global share fell from 40.0% to 38.1%. China’s share increased from 17.2% to 17.9%, while the EU’s rose from 18.2% to 19.4%.
While developed markets still dominate overall, these figures suggest the composition of the global market is gradually shifting.
Since these figures are reported in U.S. dollars, exchange-rate movements can also affect year-to-year comparisons.
Learn More on the Voronoi App
To learn more about the debt profiles of different markets, check out Visualized: All The Debts In the World on Voronoi.