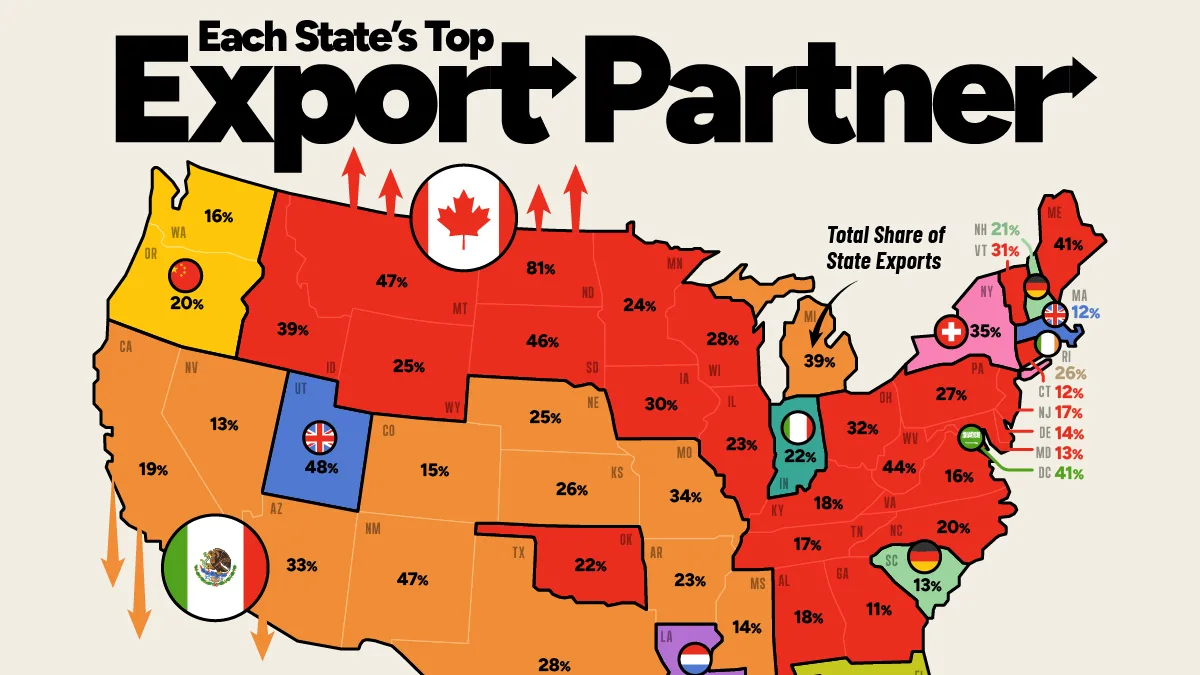
Mapped: Each U.S. State’s Top Export Partner
Key Takeaways
- Canada and Mexico are the top export destinations for 37 of the 50 U.S. states.
- Canada ranks first for 25 states, while Mexico is the leading export partner for 12 states.
- Among states with other top export destinations, New York exports most to Switzerland, Utah to the UK, Oregon and Washington to China, and New Hampshire and South Carolina to Germany.
International trade patterns vary widely across the United States, reflecting geography, industry, and access to major transportation networks.
Using 2025 data from the U.S. Census Bureau, this map shows the country to which each state exports the most goods, based on NAICS-3 goods classifications.
Canada Dominates the Northern U.S.
Canada is the leading export market for half of all U.S. states, including much of the northern United States.
North Dakota has the greatest dependence on a single partner in the dataset, with Canada accounting for 80.6% of its exports.
| State or District | Top Export Partner (2025) | Total Share of State Exports |
|---|---|---|
| North Dakota |  Canada Canada |
80.6% |
| Utah |  UK UK |
48.1% |
| Montana | Canada |
46.6% |
| New Mexico |  Mexico Mexico |
46.6% |
| South Dakota | Canada |
45.9% |
| West Virginia | Canada |
44.1% |
| Maine | Canada |
41.2% |
| D.C. |  Saudi Arabia Saudi Arabia |
40.9% |
| Idaho | Canada |
38.6% |
| Michigan | Mexico |
38.5% |
| New York |  Switzerland Switzerland |
34.7% |
| Missouri | Mexico |
34.1% |
| Arizona | Mexico |
32.7% |
| Ohio | Canada |
32.3% |
| Vermont | Canada |
30.8% |
| Iowa | Canada |
30.4% |
| Wisconsin | Canada |
27.9% |
| Texas | Mexico |
27.8% |
| Pennsylvania | Canada |
26.7% |
| Rhode Island |  Ireland Ireland |
26.2% |
| Kansas | Mexico |
25.7% |
| Hawaii |  Australia Australia |
24.6% |
| Nebraska | Mexico |
24.6% |
| Wyoming | Canada |
24.6% |
| Minnesota | Canada |
23.9% |
| Illinois | Canada |
22.6% |
| Arkansas | Mexico |
22.5% |
| Oklahoma | Canada |
22.3% |
| Indiana |  Italy Italy |
21.6% |
| New Hampshire |  Germany Germany |
20.6% |
| North Carolina | Canada |
19.9% |
| Oregon |  China China |
19.5% |
| California | Mexico |
18.5% |
| Alabama | Canada |
18.2% |
| Kentucky | Canada |
18.2% |
| Tennessee | Canada |
17.3% |
| New Jersey | Canada |
16.8% |
| Alaska |  South Korea South Korea |
16.3% |
| Washington | China |
15.6% |
| Virginia | Canada |
15.5% |
| Colorado | Mexico |
14.8% |
| Delaware | Canada |
14.1% |
| Mississippi | Mexico |
13.6% |
| South Carolina | Germany |
13.3% |
| Maryland | Canada |
13.2% |
| Nevada | Mexico |
13.1% |
| Connecticut | Canada |
12.4% |
| Massachusetts | UK |
11.6% |
| Georgia | Canada |
11.4% |
| Florida |  Brazil Brazil |
7.7% |
| Louisiana |  Netherlands Netherlands |
7.4% |
Montana follows, with Canada taking 46.6% of exports, while South Dakota and West Virginia send 45.9% and 44.1%, respectively.
U.S. exports to Canada totaled $426 billion in 2025, led by industrial machinery, motor vehicles, and energy products.
As shown in this other graphic, Canada is also a major trading partner for U.S. imports by state.
Mexico Leads Across the Southwest
Mexico is the top export destination for 12 states, with its strongest concentration across the Southwest and parts of the Midwest.
New Mexico sends 46.6% of its exports to Mexico, the highest share among states where Mexico ranks first.
Michigan follows at 38.5%, reflecting the highly integrated North American automotive supply chain. Missouri, Arizona, and Texas also send more than one-quarter of their exports to Mexico.
U.S. goods exports to Mexico totaled $391 billion in 2025, led by electrical machinery, machinery, energy products, vehicles, and plastics.
Some States Look Far Beyond North America
Several states stand out for having their largest export markets outside Canada and Mexico.
New York sends 34.7% of its exports to Switzerland, while Utah sends 48.1% to the United Kingdom.
China is the top destination for Oregon and Washington, while Germany ranks first for New Hampshire and South Carolina.
Other notable pairings include Alaska with South Korea, Hawaii with Australia, Florida with Brazil, and Indiana with Italy.
Being a state’s largest export partner does not always mean dominating its overall exports.
Florida’s leading market, Brazil, accounts for just 7.7% of state exports, while Louisiana’s top destination, the Netherlands, accounts for 7.4%.
Learn More on the Voronoi App 
If you enjoyed today’s post, check out this graphic mapping America’s $1.24 trillion trade deficit.